A couple of months ago, I wrote a post about a promising development in using Sodium in the chemistry for FePO4F cathode cells. Now I have a promising development to report on anode materials.
In an advance on-line letter to Nature Nanotechnology, Chan et al., report on the use of silicon nanowires in the place of the more common carbon graphite anode material ("High-performance lithium battery anodes using silicon nanowires", Nat. Nano. (advanced online) 16 December, 2007).
Silicon is, theoretically, a superior material for the anode compared to carbon. The theoretical charge capacity for a lithium-silicon battery is around 4.2 Ah g-1 compared to 0.37 Ah g-1 for graphite-based anodes. In the experiment, they achieved stable performance around 3.1-2.1 Ah g-1 for the output. Just by way of comparison, if one could achieve a cell voltage of 3.5 V and 2.5 Ah g-1 charge capacity, that corresponds to 8.75 kWh/kg or 31.5 MJ/kg (of anode material only -- the remainder of the battery might constitute +75 % of the mass). Gasoline (iso-octane) contains 44.4 MJ/kg and only about 30 % of that is actually used as work in spinning the wheels. So this is a potentially very significant result. When you take into account the greater mass of an internal combustion engine compared to an electrical motor, the electrical car has potentially a higher energy density.
However, silicon suffers from a massive volume change when transforming from lithium loaded to unloaded -- about 400 %. In comparison, the previous article on a sodium-ion cathode material reported an improvement in volume change to 3.7 % from 6.7 %! Obviously, these are not even remotely in the same regime, aside from the fact that one is an anode and the other the cathode. As I explained previously, the volume change is often a good indicator as to the resilience of a battery over tens of thousands of cycles. A 6.7 % can be accommodated by a crystal lattice without major movement of individual atoms. A 400 % volume change implies massive bond breaking and reconfiguration. There is no way a crystalline material can withstand such changes so any silicon anode must be amorphous.
The advance reported by Chan et al. is to form the silicon into a 'forest' of small diameter (~100 nm or several hundred atoms across) nanowires. Nanowires are, in general, better able to handle large changes in dimension due to thermal expansion, etc., because they can elongate freely without breaking up. Nanowires may also accommodate stress by curling up, like a spring. If a bulk material tried to expand that much, it would run into the material to its right and left, they would have a violent disagreement as things often do when they run out of space, and everything would (literally) fall apart.
From a manufacturing perspective, it is fairly straight-forward to fabricate such a 'forest' of nanowires. A typical method would be to anneal a thin film of Silicon Sub-oxide (i.e. SiOx, where x < 2) in a thin atmosphere of Silane gas (SiH4) that has some small catalyst (Fe/Ni) particles embedded in it. In this case, they used gold nanoparticles on a nickel substrate. The catalysts absorb silicon from the gas and grow outwards, forming nanowires.
The nanowires Chan et al. grew were initially crystalline but they found via electron microscopy that they quickly became amorphous after cycling. This phase change was accompanied by a significant loss of performance. The charge capacity was found to be 4.277 Ah g-1 after the first cycle to 3.541 Ah g-1 for the second. The efficiency of the cells was only 72 % for the first cycle but rose to 90 % after that, which is typical for lithium cells (i.e. multiply the given charge capacity by the efficiency to get the charge they got out of the cells). The author's report that, "The mechanism of the initial irreversible capacity is not yet understood and requires further investigation." I don't think it's a stretch to infer that the phase change from crystalline to amorphous is the reason. One would likely achieve better results by starting with amorphous silicon nanowires and not putting the system through that initial shock.
On the negative side, the volume change is still immense. I'm unsure that these structures can hold up over tens of thousands of cycles like other chemistries can. The report only conducted 10-20 cycles. While the graphs shown in the paper the suggest the performance becomes asymptotic (stabilizes) at 20 cycles, that likely is due to the phase change from crystalline to amorphous being fully completed. There could well be some 'cliff' out around several hundred cycles where the wires embrittle and begin to break.
Update: edited to fix a broken tag that ate a chunk of the post. Silly blogger editor.
19 December 2007
18 December 2007
Distributed Hourly Wind Data
I am going to poll my readers for help on a problem. I am trying to find meteorological data for wind speed from a number of geographically separated weather stations. By geographically separated I mean, on the scale of Texas or Ontario. I need the data to be measured hourly or faster. The data needs to be in some reasonable downloadable format so that I can parse it without too many difficulties.
Thus far, most of the data I've found is proprietary and people want me to pay for it. Since I don't make any money writing this blog, I'm not willing to do that. The only source of decent free data I've found is from the University of Waterloo.
Thus far, most of the data I've found is proprietary and people want me to pay for it. Since I don't make any money writing this blog, I'm not willing to do that. The only source of decent free data I've found is from the University of Waterloo.
06 December 2007

23 November 2007
Retro Energy Crisis Fixes
CBC put together a charming slide show of the Energy Crisis, circa 1972.
My favourite is #7, the underground home:
 Look closely at the background. It's a
 map matte painting. I wonder why this concept didn't take off...
My favourite is #7, the underground home:
 Look closely at the background. It's a
 05 November 2007
Normalized Crude Oil Prices
There has been much gnashing of teeth in the media lately regarding what appears to be an unprecedented run up in crude oil prices, in particular since the US Federal Reserve dropped their prime interest rate a couple of weeks ago.
Last time I bothered to look at oil prices was May 2006 where I postulated that peak oil phenomena originally manifested itself around January 2002 — a local low in oil prices. Since then, the price for oil has been trending upwards, more or less linearly. Since everyone seems so keen to blame futures traders for this, I thought I would look at the numbers and see just how far debased from this linear regression the price currently is. Is it a six sigmaTM event? Or merely likely?
I have since developed a correction to my model, which I now call McLeod's Omniscient Regression-fit for Oil-price Normalization (MORON). In this new model, I normalize the price of oil against the the Atlanta Fed's US dollar index, to account for the fact that that the US dollar has deflated (or devalued if you prefer) in value against the global bag of currencies by 20 % over the given time period of January 2002 – November 2007.
The model utilizes the EIA's world average price for crude, which is a fair bit lower than the list price we see on the evening news. The EIA's numbers are somewhat less volatile than the future's prices, and frankly more representative of the price of gasoline and other oil products. To normalize to the value of the US dollar, I use the basket published by the Atlanta Fed. Note that this basket is actually favourable to the US dollar, since it allows some pegged currencies into the mix. Compared to the Euro or Canadian dollar, the US dollar's drop has been more precipitous. Still, a 20% drop over 5 years is nothing to sneeze at.
 Figure 1: Crude oil price, US dollar index, and normalized crude oil price for the period
from January 2002 to Novemember 2007 and least squares linear fits to data sets.
From Figure 1 we can see that while there are clearly a number of periodic signals in the price of oil (blue), there also appears to be a background that we can reasonably approximate with a linear regression (green line). Fortuitously we can also plot the US dollar index (red — abbreviated Index$) on the same axis, showing its gradual decline (magenta). If we multiply the dollar index by the crude oil price, we can arrive at a normalized crude oil price, (grey) compensating the influence of the declining US dollar, and its fit (black line). A close examination of the difference between the current oil price and its background suggests that it not a very significant event. It is clearly less significant than the peaks in 2005 and 2006.
In fact, if you look prior to 2002, it is quite remarkable that the US dollar index hit a peak just two months after the price of oil started to rise. Perhaps this has something to do with trade deficits or some such thing? Nonsense I'm sure, a giant oil pig like the USA couldn't possibly be driving the value of its fiat currency down by purchasing a constant volume of a resource that continuously increases in price.
Table 1: Linear Regression Fits to Crude Oil Price Indices
The most interesting data from Figure 1 is encapsulated in Table 1. Namely, we get the slope of those nice curves, as well as the unpresented data from my 2006 post. The correlation is not wholly perfect, there is clearly some additional periodic signal in the result after subtracting away the linear fit.
So looking at the change in the price of oil over time (i.e. the price velocity), has it changed since I last looked at it in 2006? It's changed from 9.56 to 9.36 US$/bbl·year. So in fact it's still less than one sigma difference, which is roughly a 68 % confidence interval. For reference, two sigma is about a 95 % confidence interval.
The expected price for crude from the linear curve is 69.95 ± 5.33 US$/bbl in unadjusted dollars and 56.78 ± 4.55 Index$/bbl in normalized dollars. The stated error in this case is the root mean square (RMS) standard error. Compared to the actual final prices given in Table 1, then we're at +11.32 US$/bbl but only +6.02 Index$/bbl. On the US dollar scale, the jump up in oil prices looks possibly significant, but there's nothing at all of interest from the crude price normalized by the dollar index.
Another issue that one might be interested in is the spread between what the world actually pays, and the stock ticker for West Texas at Cushing, OK. Perhaps the traders are pushing that number up? Mean WTI spot crude price for the week of January 7th, 2002 was US$20.54/bbl, whereas for the the week of October 26th, 2007 it was US$89.23/bbl. The spread, then was $1.86/bbl (+9.96 %) back then and $7.96/bbl (+9.8 %) now. The proportional surcharge for that convenient oil appears to be remarkable stable. One's dollars still buy an equivalent number of barrels of WTI crude compared to the world average as they did back in 2002.
Now, the data that I've used is a couple of weeks old, but there's no getting around that. If you want to use the up to the minute spot prices for a commodity, rather than what people actually end up paying, you'll quite possibly come away with the wrong impression. Overall though, it seems clear, this run up in price is not really different in any functional sense. The drop in the US dollar is a nasty little self-reinforcing cycle thanks to the fact that a very large portion of the US trade deficit is due to importing roughly 15 million barrels of oil every day. If anything, I am undercompensating for the deflation of the US dollar. If people aren't willing to purchase US debt to offset that money flow, well, the results are pretty obvious. Therein lies the fallout from the US mortgage crisis, in that the world's gone on a mortgage debt diet. Whether or not we will see any large shifts in crude oil prices due to the mortgage business remains to be seen. Thus far, my fairly simple analysis suggests we haven't seen any significant shifts.
Last time I bothered to look at oil prices was May 2006 where I postulated that peak oil phenomena originally manifested itself around January 2002 — a local low in oil prices. Since then, the price for oil has been trending upwards, more or less linearly. Since everyone seems so keen to blame futures traders for this, I thought I would look at the numbers and see just how far debased from this linear regression the price currently is. Is it a six sigmaTM event? Or merely likely?
I have since developed a correction to my model, which I now call McLeod's Omniscient Regression-fit for Oil-price Normalization (MORON). In this new model, I normalize the price of oil against the the Atlanta Fed's US dollar index, to account for the fact that that the US dollar has deflated (or devalued if you prefer) in value against the global bag of currencies by 20 % over the given time period of January 2002 – November 2007.
The model utilizes the EIA's world average price for crude, which is a fair bit lower than the list price we see on the evening news. The EIA's numbers are somewhat less volatile than the future's prices, and frankly more representative of the price of gasoline and other oil products. To normalize to the value of the US dollar, I use the basket published by the Atlanta Fed. Note that this basket is actually favourable to the US dollar, since it allows some pegged currencies into the mix. Compared to the Euro or Canadian dollar, the US dollar's drop has been more precipitous. Still, a 20% drop over 5 years is nothing to sneeze at.
 Figure 1: Crude oil price, US dollar index, and normalized crude oil price for the period
from January 2002 to Novemember 2007 and least squares linear fits to data sets.
From Figure 1 we can see that while there are clearly a number of periodic signals in the price of oil (blue), there also appears to be a background that we can reasonably approximate with a linear regression (green line). Fortuitously we can also plot the US dollar index (red — abbreviated Index$) on the same axis, showing its gradual decline (magenta). If we multiply the dollar index by the crude oil price, we can arrive at a normalized crude oil price, (grey) compensating the influence of the declining US dollar, and its fit (black line). A close examination of the difference between the current oil price and its background suggests that it not a very significant event. It is clearly less significant than the peaks in 2005 and 2006.
In fact, if you look prior to 2002, it is quite remarkable that the US dollar index hit a peak just two months after the price of oil started to rise. Perhaps this has something to do with trade deficits or some such thing? Nonsense I'm sure, a giant oil pig like the USA couldn't possibly be driving the value of its fiat currency down by purchasing a constant volume of a resource that continuously increases in price.
Table 1: Linear Regression Fits to Crude Oil Price Indices
| Data Set | Crude Initial Price ($/bbl) | Crude Final Price ($/bbl) | Crude Price Velocity ($/bbl·year) | Standard Deviation of Velocity (±$/bbl·year) | Correlation Coefficient (R2) |
| Jan2002-June2006 | 18.68 | 62.26 | 9.56 | 0.24 | 0.8707 |
| Jan2002-Nov2007 | 18.68 | 81.27 | 9.36 | 0.18 | 0.8979 |
| Normalized Jan2002-Nov2007 | 18.68 | 62.80 | 6.84 | 0.16 | 0.8657 |
The most interesting data from Figure 1 is encapsulated in Table 1. Namely, we get the slope of those nice curves, as well as the unpresented data from my 2006 post. The correlation is not wholly perfect, there is clearly some additional periodic signal in the result after subtracting away the linear fit.
So looking at the change in the price of oil over time (i.e. the price velocity), has it changed since I last looked at it in 2006? It's changed from 9.56 to 9.36 US$/bbl·year. So in fact it's still less than one sigma difference, which is roughly a 68 % confidence interval. For reference, two sigma is about a 95 % confidence interval.
The expected price for crude from the linear curve is 69.95 ± 5.33 US$/bbl in unadjusted dollars and 56.78 ± 4.55 Index$/bbl in normalized dollars. The stated error in this case is the root mean square (RMS) standard error. Compared to the actual final prices given in Table 1, then we're at +11.32 US$/bbl but only +6.02 Index$/bbl. On the US dollar scale, the jump up in oil prices looks possibly significant, but there's nothing at all of interest from the crude price normalized by the dollar index.
Another issue that one might be interested in is the spread between what the world actually pays, and the stock ticker for West Texas at Cushing, OK. Perhaps the traders are pushing that number up? Mean WTI spot crude price for the week of January 7th, 2002 was US$20.54/bbl, whereas for the the week of October 26th, 2007 it was US$89.23/bbl. The spread, then was $1.86/bbl (+9.96 %) back then and $7.96/bbl (+9.8 %) now. The proportional surcharge for that convenient oil appears to be remarkable stable. One's dollars still buy an equivalent number of barrels of WTI crude compared to the world average as they did back in 2002.
Now, the data that I've used is a couple of weeks old, but there's no getting around that. If you want to use the up to the minute spot prices for a commodity, rather than what people actually end up paying, you'll quite possibly come away with the wrong impression. Overall though, it seems clear, this run up in price is not really different in any functional sense. The drop in the US dollar is a nasty little self-reinforcing cycle thanks to the fact that a very large portion of the US trade deficit is due to importing roughly 15 million barrels of oil every day. If anything, I am undercompensating for the deflation of the US dollar. If people aren't willing to purchase US debt to offset that money flow, well, the results are pretty obvious. Therein lies the fallout from the US mortgage crisis, in that the world's gone on a mortgage debt diet. Whether or not we will see any large shifts in crude oil prices due to the mortgage business remains to be seen. Thus far, my fairly simple analysis suggests we haven't seen any significant shifts.
24 October 2007
Alberta Natural Gas Situation, 2002 - 2007
Since I've been bleating on about the production of natural gas in Alberta for awhile, it's probably time to put up some data, pretty pictures, and make some predictions. I retrieved some data from the Alberta Energy and Utilities Board, both for natural gas production and also drilling rates.
 Figure 1: Annual Alberta natural gas production
(extrapolated for 2007).
Alberta has been producing roughly 168,000 million m3 of natural gas per annum over the last five years as shown in Figure 1. Looks nice and stable with natural gas prices in North America being also rather low. No problems seen thus far.
 Figure 2: 'Capable' and 'Operating' wells in Alberta.
If we look at the actual number of wells in the province, as shown in Figure 2, it has grown greatly over the past five years, even as production has not. There are two discontinuities in the data, the origin of which are not clear. I presume it is due to some accounting methodology change. The number of operating wells has grown from roughly 61,000 wells in January 2002 to 101,000 wells in June 2007.
Given the flat production figures, and 65 % growth in the number of operating wells over 4.5 years, the rate of decline for production per well is 11.2 %/annum. That's assuming production has been flat. If you take into account the observed decline from 170,828 million m3 in 2002 to the projected 166,795 million m3 in 2007, the rate of decline for production per well is 11.7 %/annum.
On the positive side, the difference between the number of available wells and those actually producing gas appears relatively stable. If this gap started to tighten up, it would suggest there is no more surplus capacity in the infrastructure. The natural result would be a rise in North American natural gas prices, notwithstanding the influence of LNG.
As an aside, the first coal-bed methane wells began to appear in December 2004. There are 7850 operating coal-bed methane wells as of August 2007, forming 7.6 % of the total wells at that time.
 Figure 3: Drilling rates for new development (production)
and exploration of natural gas wells. End-points of moving
averages not considered statistically accurate.
So we have clearly established that for Alberta to maintain its natural gas production, it will need to drill more and more holes in order to offset the decline in existing fields. Unfortunately, the drilling data suggest that isn't going to happen. Rather, drilling rates for new production holes has dropped off from about 950 holes per month in 2005 to 650 holes per month now, a decline of about 30 %. Exploration of new sites is also dropping off at a similar proportion.
Now, obviously, this data has a lot of noise to it. One particular feature of interest is the drop-off in drilling in April that happens every year. Since April is the end of the financial year in Canada, my best guess is that numbers are being shifted for tax purposes. Still, I think the 12 month moving averages are stable enough to draw the inference that drilling activity in Alberta has dropped substantially from the peak of the 'boom'.
In conclusion, the general treads are clear. Alberta had a boom in natural gas production with activity peaking in 2005. However, that peak in drilling is over, and existing reserves are depleting rapidly. The shortfall will be shored up by coal-bed methane, but that method of natural gas production inherently has smaller production volumes per hole, and requires more extensive drilling. The data from the US Energy Information Admission on Canada's natural gas reserves suggests that this decline is being driven by geological considerations (i.e. we're running out of conventional natural gas) rather than the purely historical 'boom-bust' cycle of Alberta's economy.
The future of the natural gas industry in Alberta will, in my opinion, be largely determined by the degree to which liquefied natural gas (LNG) imports penetrate the North American market. If LNG can be delivered economically, Alberta natural gas will remain uncompetitive and this could be a real historical peak. On the other hand, if supplies tighten, prices will rise in much the same fashion as crude oil is now and we should see another boom period until the coal-bed reserves are fully covered.
Premier Ed Stelmach is to deliver a speech tonight regarding his decision on fossil fuel royalties in Alberta. I think that he has little choice but to raise royalties on bitumen producers, since otherwise he will face budget deficits in the future as the revenue from natural gas production declines.
11 October 2007
Alberta Natural Gas Production to Decline by 15 % by 2009
According to Claudia Cattaneo of the Financial Post, "Gas Output to Plummet" weaves us a story of how conventional natural gas production is posed to decline 7 % per annum over the next couple of years.
No shit.
Quote of the day:
Those bitumen sands upgrading operations that are relying on natural gas to add hydrogen to their asphalt better pay attention. If it comes down to a question of heating homes or running refineries, you're going to lose your supply.
No shit.
Quote of the day:
"Drilling for natural gas is in a deep recession unique to Western Canada because of high costs, the high Canadian currency and less-productive wells as the basin matures."Point number two is a red herring, the Canadian dollar was much lower when this decline in drilling rates started. It's certainly an issue now, as a subset of point one, but it wasn't the proximate cause. The real issue is point three, that the resource is in decline, which in turn means that the cheapest gas is gone. The North American price for natural gas remains rather low, so expect a squeeze, especially if LNG isn't deployed fast enough to cover the shortfall. As we saw in 2005/6, natural gas prices are considerably more volatile than oil, due to the less fungible nature of gas compared to oil.
Those bitumen sands upgrading operations that are relying on natural gas to add hydrogen to their asphalt better pay attention. If it comes down to a question of heating homes or running refineries, you're going to lose your supply.
01 October 2007
Sodium-ion Batteries
In a new issue of the journal Nature Materials, there is an article about a new formulation of the lithium-iron-phosphate chemistry, but with sodium substituted for lithium. This is potentially advantageous from a cost perspective, especially as concerns have been raised as to whether or not their are sufficient proven reserves of lithium metal to convert the entire world's vehicle fleet to lithium-ion batteries. Sodium is vastly more abundant.
The citation is, B.L. Ellis et al., "A multifunctional 3.5 V iron-based phosphate cathode for rechargeable batteries," Nature Mat. 6:749 - 753 (2007). Nature only provides the first paragraph to the public, so I will try to provide a synopsis.
The basic formulation of the cathode for this battery is A2FePO4F, where A is either Li, Na or some mixture thereof (with a standard carbon anode). Most lithium-ion battery aficionados are aware that the phosphate chemistry is perhaps looked upon more favourably at the moment than nickel or maganese based ones. The substitution of the fluoride from a hydroxide (OH) is another innovation that results in a novel crystal structure.
The material seems to form favourably shaped porous crystallites with a very high surface area to volume ratio, as shown by scanning electron microscopy in the publication. The crystallites are about 200 nm across, which by my standards is still quite large (i.e. they have plenty of room to decrease it). The cells were producing ~ 3.6 V over a rather flat discharge curve, and maintained a capacity of 115 mA·hr g-1 after 50 cycles. That would correspond to a storage capacity of roughly 400 W·hr kg-1 for the battery bereft of any packaging.
Aside from the potential for replacing lithium, the authors also found little volume change when Na was lost from the NaFePO4F crystal. This implies there's not a lot of stress on the crystal during reduction-oxidation (i.e. cycling), and hence, it may imply a high degree of reversibility (i.e. a battery fabricated from the material may be able to handle many cycles without damage). The volume change was found to be 3.7 %, compared to 6.7 % for conventional Li2FePO4OH chemistry.
Right now they appear to be suffering from a carbon coating on their material that appears to be a result of their fabrication method. This is having a negative effect on the conductivity of the material, which would impact battery efficiency.
Overall, an interesting development that points to plenty of room left for chemistry advances in the area of battery technology. There is also a lot of room for this material in terms of its material science, being brand new and hardly optimized for performance.
27 September 2007
Alberta Bitumen Royalties, Sidestepping Carbon Checks, et al.
The biggest news to come out in awhile from the Alberta bitumen development was a committee report detailing how the province has been short-changed to the tune of 4 billion dollars by not changing the royalty structure since the price of oil took off in 2002. According to one newspaper article the report has been downloaded over 200,000 times. The article quotes Jay O'Neill, spokesman for Alberta Finance, inferring that many of the hits are from out of province — presumably investors. I don't know if this is backed up by actual hit tracking or not.
This puts the newish Premier Ed Stelmach in a bit of a tight spot. For one, he was the minister in charge of royalties for the period this report covered. Hence, if he admits to the royalties being mismanaged, it occurred on his watch. The big meme that appeared in the Alberta newspaper's was the royalty on bitumen sales (or lack thereof). The report recommended a royalty of 33 % after recovery of capital costs. The Premier's office gave him a month to craft a reply, which is rather extended for a politician who is already developing a reputation for doing nothing. The opposition Liberals have previously proposed a similar royalty rate at 25 %, which puts the Premier in a tough spot, since they are ahead of the news and he is not. If he accepts the committee's numbers, he'll come off as less business friendly than the opposition and irritate many of his doners. If he takes a month to arrive at the same figure, he'll just be reinforcing the 'Mr. Dithers' (or Harry Strom) stereotype. If he low balls the royalty, he'll be accused of being in the oil corporations' pocketbooks.
Toronto Dominion bank economist Don Drummond thinks that Alberta's not headed for the inevitable 'bust' following the 'boom', which I half agree with. Oil isn't likely to head into a price collapse given global production woes, but he seems to making the common error in underestimating the role of natural gas production in the province's prosperity. New drilling is down since 2003-4. The oil sands (bitumen) boom has also been fueling a real-estate bubble that has more or less doubled the price of homes in the prairie province the last couple of years. However, immigration is slowing slightly. Edmonton is too flat (literally) to support a real-estate bubble for an extended period. Trying to sell a 50-year old wood frame dwelling for 300x the cost of monthly rent is not rational in a city with an effectively unlimited quantity of land to start new construction on. This applies especially so in the face of rising interest rates and a US housing recession.
The other big news is that Prime Minister Harper has decided against any significant restrictions on carbon dioxide and other greenhouse gas emissions. There's some effort to disguise this as a different plan from the flawed Kyoto model, but it's hot air. The fact of the matter is that he has refused to set a price on carbon dioxide emissions, and that's all that really matters. It's been pretty obvious that he was going to take this path for awhile now. See my post, "EcoAction: Real or Greenwashing?" under the heading Airborne Pollution. I gave him an incomplete but that's clearly an 'F' now. In related news, the federal government had a $14.2 billion surplus this fiscal year. As it happens, that surplus has to be plowed into the national debt by law, but it's worth considering that it would pay $20/ton for the average 20 tons of CO2 emitted by all of 33 million Canadians. A carbon tax that is offset by a drop in income tax shouldn't cost nearly that much.
Lastly, Exxon and Murphy Oil are trying to sue the government of Newfoundland and Labrador over a clause in their contract that requires them to invest more of their development costs in the provinces themselves. They are trying to claim this under NAFTA. Good luck with that... Resources belong to the province; the federal government doesn't have a lot of say in their management. Also, Harper will not do anything since it would set a president that could be applied to Alberta at a later date. Furthermore, it's not like someone held a gun to the head of the oil companies' head negotiator here. They signed the contract, now they can honour it or walk away from their investment.
Update: A good editorial by Fabrice Taylor in the Globe. He puts some numbers on the natural gas situation in Alberta: 60 % of all royalties come from natural gas, and not oil; existing natural gas wells are declining at a rate of 20-30 % a year, being propped up by what were previously considered stranded pockets and coal-bed methane. At current extraction rates, the conventional natural gas reserves should be gone by 2012, leaving mostly new exploration and coal-bed methane to make up the gap.
07 August 2007
Reality Check on the Condo Craze
While the US mortgage market seems to be undergoing a reality check on the excessive quantity of soft loans (see American Home Mortgage Corp), we have a similar sort of speculative bubble slowly deflating in Alberta. A popular trends has emerged of taking existing apartment complexes, subdividing them into condos, renovating them, and then liquidating the individual units for mucho profits.
This is, of course, squeezing the existing rental supply and causing price increases. I'm watching this with interest because the trend is making it more and more difficult to rent on a fixed stipend. I've already been booted out of one apartment last October and I'll have to move again in May 2008.
Alberta is currently in the midst of a labour crunch. The bitumen and gas boom is fueling the rest of the economy, and past provincal government's failure to fund public infrastructure through the 1980s has led to a surge in government spending on public works. There are a number of new condos in my immediate vicinity that have sat, uncompleted, exposed to the elements for over a year now. Needless to rising construction costs lead directly to a higher sticker price for new condos.
This does of course beg the question as to who is buying expensive 50 - 70 m2 (500 - 700 sq. ft) apartments in buildings that are 20-50 years old? The units in my past condo sold for $80,000 - $120,000 for single bedroom units which is frankly, insane for flat, flat Edmonton. Unsurprisingly it seems people aren't buying them to live in but rather as an investment to try and flip them. This is further inflationary as not only does the original owner have to pay the subcontractors for the reno and then make a profit, but the flippers also need to make a profit unless they want to eat a big serving of crow.
The number of lawn signs indicating a newly renoed condo up for sale has been rapidly proliferating. The willingness of individuals to participate in this sort of speculation game is clearly dictated by their confidence in the market. The general failure of sub-prime loans in the USA is going to have an unpleasant knock-on effect in the Canadian marketplace after the standard lag period. The major Canadian banks are, I'm sure, quite exposed to this. They claim otherwise, but they also claimed to be unexposed to the Enron fallout and ended up losing billions. Rising interest rates make the cost of holding onto these condos an expensive proposition -- in Canada fixed-rate mortgages are uncommon. All these factors seem to be posed to make dodgy 'flipping' seem a whole lot more dangerous to the average Joe. If people stop believing that the gravy train is going to continue it stands to reason that the driving force behind the condo speculation game is gone.
As an anecdote, take the building I moved out of. There are now some five 'For Sale' signs in front of the 24-unit complex, with two more in front of an 8-unit structure across the road. There's also a brand spanking new (but unfinished for over a year) 16-unit building right across the road. The rest of the neighbourhood also has a lot of signage that never seems to move. The hard reality is that no one who can afford these units actually wants to live in them. The condo frenzy was driven by false premises and now anyone who got into the game late is going to get pwned.
For me personally, I don't think I'll see much benefit aside from a great helping of schaudenfraud. While vacancy rates will probably slowly increase, the open apartments are still going to be more expensive as a result of all the inflationary pressures. The lag in rental rates to vacancy rates will probably mean that I will finish my doctorate around when rents see some real decline.
Update: Some of the European banks are starting to fess up that they are exposed to the bad mortgages in the States. I would like my readers to take note of the talking point of 'liquidity'. Clearly, some people are terrified of any sort of comparisons with the 1930s Austrian bank failures. I am distinctly reminded of Jerome a Paris' discussion of the herd mentality of bankers, and why they hold themselves on the wrong path for so long. As long as they all make the same mistakes, everything is good, especially when the state can be relied on to bail them out.
Update 2: The Bank of Canada channels Kevin Bacon in Animal House:
Quick print more money!
This is, of course, squeezing the existing rental supply and causing price increases. I'm watching this with interest because the trend is making it more and more difficult to rent on a fixed stipend. I've already been booted out of one apartment last October and I'll have to move again in May 2008.
Alberta is currently in the midst of a labour crunch. The bitumen and gas boom is fueling the rest of the economy, and past provincal government's failure to fund public infrastructure through the 1980s has led to a surge in government spending on public works. There are a number of new condos in my immediate vicinity that have sat, uncompleted, exposed to the elements for over a year now. Needless to rising construction costs lead directly to a higher sticker price for new condos.
This does of course beg the question as to who is buying expensive 50 - 70 m2 (500 - 700 sq. ft) apartments in buildings that are 20-50 years old? The units in my past condo sold for $80,000 - $120,000 for single bedroom units which is frankly, insane for flat, flat Edmonton. Unsurprisingly it seems people aren't buying them to live in but rather as an investment to try and flip them. This is further inflationary as not only does the original owner have to pay the subcontractors for the reno and then make a profit, but the flippers also need to make a profit unless they want to eat a big serving of crow.
The number of lawn signs indicating a newly renoed condo up for sale has been rapidly proliferating. The willingness of individuals to participate in this sort of speculation game is clearly dictated by their confidence in the market. The general failure of sub-prime loans in the USA is going to have an unpleasant knock-on effect in the Canadian marketplace after the standard lag period. The major Canadian banks are, I'm sure, quite exposed to this. They claim otherwise, but they also claimed to be unexposed to the Enron fallout and ended up losing billions. Rising interest rates make the cost of holding onto these condos an expensive proposition -- in Canada fixed-rate mortgages are uncommon. All these factors seem to be posed to make dodgy 'flipping' seem a whole lot more dangerous to the average Joe. If people stop believing that the gravy train is going to continue it stands to reason that the driving force behind the condo speculation game is gone.
As an anecdote, take the building I moved out of. There are now some five 'For Sale' signs in front of the 24-unit complex, with two more in front of an 8-unit structure across the road. There's also a brand spanking new (but unfinished for over a year) 16-unit building right across the road. The rest of the neighbourhood also has a lot of signage that never seems to move. The hard reality is that no one who can afford these units actually wants to live in them. The condo frenzy was driven by false premises and now anyone who got into the game late is going to get pwned.
For me personally, I don't think I'll see much benefit aside from a great helping of schaudenfraud. While vacancy rates will probably slowly increase, the open apartments are still going to be more expensive as a result of all the inflationary pressures. The lag in rental rates to vacancy rates will probably mean that I will finish my doctorate around when rents see some real decline.
Update: Some of the European banks are starting to fess up that they are exposed to the bad mortgages in the States. I would like my readers to take note of the talking point of 'liquidity'. Clearly, some people are terrified of any sort of comparisons with the 1930s Austrian bank failures. I am distinctly reminded of Jerome a Paris' discussion of the herd mentality of bankers, and why they hold themselves on the wrong path for so long. As long as they all make the same mistakes, everything is good, especially when the state can be relied on to bail them out.
Update 2: The Bank of Canada channels Kevin Bacon in Animal House:
Bank of Canada issues statement on provision of liquidity to support the stability and efficient function of financial markets
OTTAWA – In light of current market conditions, the Bank of Canada would like to assure financial market participants and the public that it will provide liquidity to support the stability of the Canadian financial system and the continued functioning of financial markets.
These activities are part of the Bank's normal operational duties relating to the stability and efficient function of Canada's financial system. The Bank is closely monitoring developments, and will deal with issues as they arise.
Quick print more money!
31 July 2007
Electricity Price Watch
Coal-fired electricity in Alberta is now up to C$0.09806 /kWh. My wind renewable energy credits are an additional C$0.02 / kWh. Of course, this is merely the incremental cost. In reality, my electrical bill is about 85 % administration and transmission fees. If I factor in the overhead, my actual price of electricity is about C$0.66 /kWh. The premium of paying for wind increases my actual electricity cost by 3 %.
It is my understanding that the deregulation of the Alberta power industry was supposed to reduce the cost to consumers.
It is my understanding that the deregulation of the Alberta power industry was supposed to reduce the cost to consumers.
25 July 2007
The Strawman Massacre
Prof. Jesse Ausubel of Rockefeller University apparently felt the need to lash out at renewable energy sources in a editorial titled "Renewable and nuclear heresies" in the journal International Journal of Nuclear Governance, Economy and Ecology (hat tip to FuturePundit). This is such an egregious piece of work that I felt a simple comment would not provide a sufficient debunking.
I cannot view the article myself as the journal is evidently not old/relevant enough for the University of Alberta to subscribe to but a press release and an older presentation (.pdf) provide some fairly outrageous strawman arguments.
First the abstract:
First strawman, hydroelectric power:
Next strawman, photovoltaics:
And the wind strawman:
He also knocks down a biomass strawman, although in this case, I happen to agree with the conclusion. Probably the worst assertion however is that renewables cannot benefit from economies of scale:
Nuclear is not going to fall in price as safety controls become more and more sophisticated folks. As I've explained previously, the big ticket item nature of nuclear puts it at a huge disadvantage compared to its smaller and nimbler competition, in terms of design cycle, capital investment, etc.
In conclusion, Prof. Ausubel seems to have developed his very own metric for greenness (square meters of stuff devoted to the production of energy), applied it in a haphazard fashion, and is now drawing some questionable conclusions from it. While I favour nuclear over coal, I really can't see nuclear competing economically with either fossil fuels or renewables. Moreover, if he feels that we already cover too much of the Earth's surface with stuff, shouldn't he preach on the demand side rather than suggesting we build more supply?
I cannot view the article myself as the journal is evidently not old/relevant enough for the University of Alberta to subscribe to but a press release and an older presentation (.pdf) provide some fairly outrageous strawman arguments.
First the abstract:
Renewables are not green. To reach the scale at which they would contribute importantly to meeting global energy demand, renewable sources of energy, such as wind, water and biomass, cause serious environmental harm. Measuring renewables in watts per square metre that each source could produce smashes these environmental idols. Nuclear energy is green. However, in order to grow, the nuclear industry must extend out of its niche in baseload electric power generation, form alliances with the methane industry to introduce more hydrogen into energy markets, and start making hydrogen itself. Technologies succeed when economies of scale form part of their conditions of evolution. Like computers, to grow larger, the energy system must now shrink in size and cost. Considered in watts per square metre, nuclear has astronomical advantages over its competitors.Ah yes, hydrogen, the system whereby energy demands increase by a factor of three (.pdf) As the man says, "to grow larger, the energy system must now shrink in size and cost."
First strawman, hydroelectric power:
Hypothetically flooding the entire province of Ontario, Canada, about 900,000 square km, with its entire 680,000 billion liters of rainfall, and storing it behind a 60 meter dam would only generate 80% of the total power output of Canada's 25 nuclear power stations, he explains. Put another way, each square kilometer of dammed land would provide the electricity for just 12 Canadians.Hmmm, but Canada already produces 58 % of its electricity from hydro and only 15 % from nuclear (source). Given that Ontario is about 10 % of the total land mass of Canada, apparently 40 % of Canada is one big lake totally devoted to hydroelectric generation. Of course, in reality, we don't build dams with only a 60 m drop. Rather one uses the natural terrain to one's advantage to channel the rainfall into a deep reservoir where it can then fall several hundred meters. If he stuck to complaining about habitat destruction, his argument would be much stronger.
Next strawman, photovoltaics:
photovoltaic solar cell plant would require painting black about than 150 square kilometers plus land for storage and retrieval to equal a 1000 MWe nuclear plant. Moreover, every form of renewable energy involves vast infrastructure, such as concrete, steel, and access roads. "As a Green, one of my credos is 'no new structures' but renewables all involve ten times or more stuff per kilowatt as natural gas or nuclear," Ausubel says.Let's see, solar insolation is about 1000 W/m2 and has a capacity factor of about 0.2. Solar cells are, on average, about 12.5 % efficient for polycrystalline Silicon. That means we get about 25 W/m2 of continuous power for PV. If we assume a 0.8 capacity factor for the reactor, I arrive at 32 km2. Prof. Ausubel's numbers seem somewhat inflated. I've previously estimated that we would need 3.5 - 7.0 m2 of panels per person to supply all of our energy needs via solar. Much of this can be done on existing (i.e. that's not 'new') urban environments.
And the wind strawman:
"Turning to wind Ausubel points out that while wind farms are between three to ten times more compact than a biomass farm, a 770 square kilometer area is needed to produce as much energy as one 1000 Megawatt electric (MWe) nuclear plant. To meet 2005 US electricity demand and assuming round-the-clock wind at the right speed, an area the size of Texas, approximately 780,000 square kilometers, would need to be covered with structures to extract, store, and transport the energy."And again, we have the same issue as with the hydroelectric strawman. The area a wind farm occupies can be used for other purposes. These numbers are not really fact-checkable. The actual area occupied by the turbine base is nowhere near 770 km2, which is what we should compare by this silly 'power per square meter of infrastructure' metric that the entire area is somehow tainted. Frankly, this seems to be something from the Not In My BackYard (NIMBY) school of environmental thought rather than 'how can we improve our health and restore sustainability to the biosphere' school of environmentalism. I.e. get that wind turbine out of my million dollar view.
He also knocks down a biomass strawman, although in this case, I happen to agree with the conclusion. Probably the worst assertion however is that renewables cannot benefit from economies of scale:
"Nuclear energy is green," he claims, "Considered in Watts per square meter, nuclear has astronomical advantages over its competitors." On this basis, he argues that technologies succeed when economies of scale form part of their evolution. No economies of scale benefit renewables. More renewable kilowatts require more land in a constant or even worsening ratio, because land good for wind, hydropower, biomass, or solar power may get used first.The argument can be made that there's only so much good hydropower and to a lesser extent wind, but this really does not apply in the case of solar. However the assertion that, "no economies of scale benefit renewables," is quite untrue. Renewables are, by in large, made up of small incremental additions to capacity. This allows them to be produced in an assembly-line fashion. While more modern nuclear designs are often 'modular', they are still essentially one-off builds. As a result, the learning rates for solar and wind are much higher (about 20 % per doubling in capacity) compared to about 6 % for nuclear. I refer to McDonald and Schrattenholzer, "Learning rates for energy technologies", Energy Policy 29(4): 255-261.
In conclusion, Prof. Ausubel seems to have developed his very own metric for greenness (square meters of stuff devoted to the production of energy), applied it in a haphazard fashion, and is now drawing some questionable conclusions from it. While I favour nuclear over coal, I really can't see nuclear competing economically with either fossil fuels or renewables. Moreover, if he feels that we already cover too much of the Earth's surface with stuff, shouldn't he preach on the demand side rather than suggesting we build more supply?
23 July 2007
War on Pasta
Corn is not a product I consume regularly, except indirectly through tasty meat products. Corn flakes? Grits/polenta? Please. But the expanding use in Canada of durum wheat for the production of ethanol goes too far. This is an affront to pasta connoisseurs everywhere, and demands government action to protect our starchy goodness.
04 June 2007
The Aluminium-Hydrogen Concept
Awhile ago there was a concept floating around the blogosphere and some alt media such as PhysOrg and Gristmill about burning a Aluminium-Gallium alloy to produce hydrogen gas for a fuel cell vehicle. Apparently incorporating a significant amount of Gallium inhibits the formation of the protective oxide layer that normally prevents aluminium from spontaneously combusting upon contact with the atmosphere. This is apparently the brainchild of Prof. Woodall at Purdue. He has a Powerpoint presentation that details the idea. It probably would have been more worthwhile for me to write about this when Robert Schwartz first prodded me a month ago, but hey better late than never.
Gallium is commonly alloyed with Aluminium, usually in conjunction with Arsenic, because they have nearly identical crystal structure but different electronic and optical properties. This allows one to grow thin layers of material with little built-in strain but rapidly changing electro-optical behaviour. It is this area of physics that is Woodall's background as an electronic engineer.
 Figure 1: Gallium-Aluminium phase diagram showing proposed alloy composed of 72 % Gallium by weight [taken from Woodall's presentation].
The first issue I noted is that it takes a lot of Gallium to inhibit protective oxide formation in Al. As shown in Figure 1, more than 2/3rd of the material is Ga and hence does nothing but act as dead weight. Gallium isn't cheap, at something like US$400/kg. Woodall was quoted by Physorg as stating,
A problem of similar magnitude with the concept is its tremendously poor cycle efficiency. Consider the enthalpy of the two associated reactions:
There are other major issues, most of which are enough to shoot down this idea on their own. Consider, for example, how do you control the rate of the reaction? If you want to deliver hydrogen to a fuel cell on demand, dripping water into a 150 kg block of AlGa alloy isn't going to get it done. The water will only be able to diffuse slowly through all the previously reacted products. In other words, not only do you need a hefty mass of AlGa pellets to make this concept work, you also need to store those pellets inside a pressure vessel in order to collect and buffer the hydrogen that is reacted. Furthermore, there is no way to refill a tank until it is empty! Hydrogen as a gas is quite difficult to pump to vacuum, which would be required to vent the tank for safety reasons.
It also has major distribution issues. Hydrogen can be pipelined; hydrogen can be reformed from natural gas or electrolysed from water locally. Hydrogen cannot be distributed with existing infrastructure, but it's possible. I can't imagine an aluminium smelter on every corner.
The AlGa alloy also could not be exposed to the atmosphere without reacting with water vapour and producing very dangerous hydrogen gas. It's actually less safe that cryogenic or pressurized hydrogen because the reaction would be slow (and hence stoichiometric with atmospheric oxygen), and the reaction is exothermic. If a fuel cell car suffers a hydrogen tank breach at least the hydrogen will be high in the sky quickly. In this case of the AlGa powered car, the wreck wouldn't be safe to approach for a very long time.
Overall I think this is a terrible idea without any redeeming qualities and I'm very surprised by the limited amount of traction it received. Apparently the US Department of Energy has declined to fund this research, and evidently for good reason. If this wasn't a professor at Purdue, no one would have given this concept a second (or even first) look.
Gallium is commonly alloyed with Aluminium, usually in conjunction with Arsenic, because they have nearly identical crystal structure but different electronic and optical properties. This allows one to grow thin layers of material with little built-in strain but rapidly changing electro-optical behaviour. It is this area of physics that is Woodall's background as an electronic engineer.
 Figure 1: Gallium-Aluminium phase diagram showing proposed alloy composed of 72 % Gallium by weight [taken from Woodall's presentation].
The first issue I noted is that it takes a lot of Gallium to inhibit protective oxide formation in Al. As shown in Figure 1, more than 2/3rd of the material is Ga and hence does nothing but act as dead weight. Gallium isn't cheap, at something like US$400/kg. Woodall was quoted by Physorg as stating,
"A midsize car with a full tank of aluminum-gallium pellets, which amounts to about 350 pounds of aluminum, could take a 350-mile trip and it would cost $60, assuming the alumina is converted back to aluminum on-site at a nuclear power plant."350 lbs. of aluminium corresponds to 900 lbs. of Gallium with an approximate value of US$160,000... and people think Li-ion batteries are expensive. Keep in mind that while this Gallium isn't consumed, it also doesn't stay with the car! It has to be traded to some vendor, the AlGa equivalent of a gas station. The potential for fraud and theft is beyond pale. How do you weigh the Ga independently of the alumina? Doesn't trading a $160,000 block of Gallium and Aluminium Oxide to get a $160,060 block of Gallium and Aluminium seem a little kooky?
A problem of similar magnitude with the concept is its tremendously poor cycle efficiency. Consider the enthalpy of the two associated reactions:
Al + O2 → Al2O3 + 1675 kJ/molThe above two equations aren't balanced, but the enthalpies are correct for the right-hand side. Now the sum reaction would be,
H2 + O2 → H2O + 285.8 kJ/mol
2 Al (bulk) + 3 H2O → 2 Al2O3 + 3 H2 + 2492 kJ/molThis should immediately raise alarm bells. Of the energy used to produce the aluminium in the first place, only 33 % is going into the hydrogen. The rest is released as heat. All that Gallium, and all that alumina reaction product, are going to act as a thermal buffer, thereby preventing you from using the heat in any sort of useful way. I haven't seen anything from Woodall to suggest one could recover this energy. When you consider that a fuel cell is perhaps 50 % efficient, and electrolysis of aluminium might be 50 % efficient on a good day (compared to 75 % for hydrogen from water), you have a system with a round trip efficiency of less than 8 %. It makes the hydrogen economy look like a paradigm of efficiency in comparison.
There are other major issues, most of which are enough to shoot down this idea on their own. Consider, for example, how do you control the rate of the reaction? If you want to deliver hydrogen to a fuel cell on demand, dripping water into a 150 kg block of AlGa alloy isn't going to get it done. The water will only be able to diffuse slowly through all the previously reacted products. In other words, not only do you need a hefty mass of AlGa pellets to make this concept work, you also need to store those pellets inside a pressure vessel in order to collect and buffer the hydrogen that is reacted. Furthermore, there is no way to refill a tank until it is empty! Hydrogen as a gas is quite difficult to pump to vacuum, which would be required to vent the tank for safety reasons.
It also has major distribution issues. Hydrogen can be pipelined; hydrogen can be reformed from natural gas or electrolysed from water locally. Hydrogen cannot be distributed with existing infrastructure, but it's possible. I can't imagine an aluminium smelter on every corner.
The AlGa alloy also could not be exposed to the atmosphere without reacting with water vapour and producing very dangerous hydrogen gas. It's actually less safe that cryogenic or pressurized hydrogen because the reaction would be slow (and hence stoichiometric with atmospheric oxygen), and the reaction is exothermic. If a fuel cell car suffers a hydrogen tank breach at least the hydrogen will be high in the sky quickly. In this case of the AlGa powered car, the wreck wouldn't be safe to approach for a very long time.
Overall I think this is a terrible idea without any redeeming qualities and I'm very surprised by the limited amount of traction it received. Apparently the US Department of Energy has declined to fund this research, and evidently for good reason. If this wasn't a professor at Purdue, no one would have given this concept a second (or even first) look.
29 May 2007
Coal Liquification Mandates Higher Electricity Prices
So the blog'o'sphere is abuzz with discussion of a New York Times piece by Edmund Andrews about proposed subsidies for Fischer-Tropsch production of benzene from coal in order to fuel oversize pickups. Call it the antithesis of demand-side management. Generally speaking the idea of large scale F-T coal-to-liquids is a program that makes corn ethanol look like a model of efficiency.
For one thing, I don't see how this adds to the USA's energy security. The F-T process is a net energy loser, and it's not like the USA is a major coal exporter. According to the Energy Information Administration statistics on coal the USA exports about 50 Mtons of coal, imports 30 Mtons, and produces about 1200 Mtons. This means the USA's net coal exports only amount to 1.7 % of total production. While the USA may have the worlds largest coal reserves, historically coal reserve numbers haven't proven to be very accurate and it certainly doesn't look like there's a lot of spare capacity.
This also puts paid to the fig leaf of carbon dioxide sequestration. While coal-fired electricity can claim they are working on sequestration, F-T fuel really can't sequester their product, only the inefficiencies in producing it. As such, they will make themselves even more vulnerable toacquisitions accusations that they are cooking the planet then they already are.
So it would seem that the proposal is to trade away the USA's self sufficiency in electricity production in order to slightly reduce oil imports. What's more important, fueling your car or heating your house? Of course, coal executives don't care about the average consumer, they care about their profits. However, I'm not sure why the American taxpayer should subsidize this. What do the American people get from this? A quote from the NY Times article is illustrative:
Update: From the NY Times, Science Panel Finds Fault With Estimates of Coal Supply. -cough- Coal reserve estimates inaccurate? I'm shocked.
For one thing, I don't see how this adds to the USA's energy security. The F-T process is a net energy loser, and it's not like the USA is a major coal exporter. According to the Energy Information Administration statistics on coal the USA exports about 50 Mtons of coal, imports 30 Mtons, and produces about 1200 Mtons. This means the USA's net coal exports only amount to 1.7 % of total production. While the USA may have the worlds largest coal reserves, historically coal reserve numbers haven't proven to be very accurate and it certainly doesn't look like there's a lot of spare capacity.
This also puts paid to the fig leaf of carbon dioxide sequestration. While coal-fired electricity can claim they are working on sequestration, F-T fuel really can't sequester their product, only the inefficiencies in producing it. As such, they will make themselves even more vulnerable to
So it would seem that the proposal is to trade away the USA's self sufficiency in electricity production in order to slightly reduce oil imports. What's more important, fueling your car or heating your house? Of course, coal executives don't care about the average consumer, they care about their profits. However, I'm not sure why the American taxpayer should subsidize this. What do the American people get from this? A quote from the NY Times article is illustrative:
But coal executives anticipate potentially huge profits. Gregory H. Boyce, chief executive of Peabody Energy, based in St. Louis, which has $5.3 billion in sales, told an industry conference nearly two years ago that the value of Peabody’s coal reserves would skyrocket almost tenfold, to $3.6 trillion, if it sold all its coal in the form of liquid fuels.So what's the obvious side effect here? Higher electricity prices, obviously. The cost of coal constitutes about 50 % of the cost of coal-fired thermal electricity generation. Hence, if the value of coal shoots up by a factor of ten as suggested the price of coal-fired electricity should go up 5-fold. The coal executives would be giveing a gift to their competition. Nuclear, wind, and solar power would quickly become more competitive and start to displace coal-fired generation. The last thing the coal industry should logically want is to encourage the installation of more wind and solar power; these industries have learning rates that will eventually push their cost below that of coal. Why would an coal executive hasten that? One can certainly imagine that if enough coal is displaced, the price will again crash. Hence they coal executive might in the end have all the coal they want to produce F-T benzene. This is assuming their corporations survive the roller-coaster ride they are setting themselves up for and don't go bankrupt.
Update: From the NY Times, Science Panel Finds Fault With Estimates of Coal Supply. -cough- Coal reserve estimates inaccurate? I'm shocked.
15 May 2007
The Glittering Future of Solar Power:
Prognostication of Photovoltaic Capacity Extrapolated from Historical Trends
Historically the photoelectric effect has been known for a couple hundred years ever since it was observed in elemental Selenium around the turn of the 19th century. It became practical to use the photoelectric effect to generate power with the development of the transistor in 1947 that lead directly to Germanium (and later Silicon) solar cells that could produce a useful amount of electricity. Early solar cells saw use in extreme applications, such as providing power for satellites. Serious efforts to develop photovoltaic cells for commercial power production wasn't undertaken until the Arab oil crisis's of the 1970s. The USA developed an early dominance in the technology, but that advantage withered as the memory of the oil crisis faded from public view and successive administrations ignored the technology. More recently interest in photovoltaics has been rekindled due to concern around global warming, predominately supported by programs in Germany and Japan, whose domestic manufacturers now produce the bulk of solar cells. Research and development in photovoltaic technology is proceeding at a frenzied pace, as triple-junction thin-film silicon and Copper-Indium-Gallium-Selenide (CIGS) cells are posed to take over market share from traditional polycrystalline silicon wafers sawed from solid ingots. In the future decades, nanotechnology and organic semiconductors offer the potential for new generations of solar power technology.
Photovoltaic cells are not like any other method humanity uses to collect and use energy. Existing techniques extract energy either from mechanical motion (wind, hydroelectric, tidal) or heat differentials (fossil fuels, nuclear, solar-thermal). Whereas all these systems produce useful work by the turning of a shaft photovoltaics convert sunlight directly into direct-current electricity. While photovoltaics are still beholden to the laws of thermodynamics and entropy, the difference still implies that they abide by difference rules. In particular, they have a total absence of moving parts and as a result are almost free of maintenance requirements. Photovoltaic cells degrade in performance only very slowly as they are bombarded by cosmic rays. Most manufacturers offer warranties that guarantee they will still reach 80 % of their rated power output after 25-years.
It seems minute, and it is, for now. However, solar production hasn't been growing at 3.2% per year. It has, in fact, been growing at 33 % per annum for the last decade [2], and it's expected to continue that trend for the immediate future. The cumulative installed capacity can be expressed as

As one can see from Figure 1, while the impact of solar may be trivial now, it will not be over the next 25 years. If solar can maintain the same growth rate is has for the past decade, solar can supply all of mankind's projected electricity demands 26 years from now.

The learning rate of photovoltaics is much higher than that of other energy technologies. In fact, it's more in-line with things like computers or DVD players. This fact should surprise no one; as I mentioned in the introduction, photovoltaics are different from all other forms of energy production. The small incremental nature of photovoltaics is a major advantage from a R&D perspective, as I've described previously. While coal and nuclear power plants are installed in increments of hundreds or thousands of megawatts, solar panels are measured in the hundreds of watts. Thus while a design change to a nuclear power plant can take a decade or more to manifest itself, solar manufacturers can do this in weeks. As a result, photovoltaic technology will go through hundreds of design revisions in the time it takes coal or nuclear plants to go through one. Some learning rates for various technologies are listed in Table 1. One thing to take from the table is not only that photovoltaics have a superior learning rate, but that they also have so much further to grow.
Current panel costs are treading at around $4.80/Wp, and the various extras such as frames, labour cost an addition $2.50/Wp. I'll use two locations to establish a baseline for the cost of photovoltaic power: Stuggart, Germany and Los Angeles, USA. A Retscreen analysis shows that the Stuggard location produces 1.089 MWh/year /kWp (which represents a capacity factor of 0.17) and LA produces 1.605 MWh/year /kWp (capacity factor 0.25). Simulations in RETSCREEN find that amortized over 25 years these locations can produce power at $0.24/kWh in Stuggart and $0.21/kWh in California [4]. Financial assumptions are: energy inflation is equal to monetary inflation, interest is 1.0 % above prime (government rates).
World residential electricity prices are generally lower than this [5]. France, which is primarily nuclear, has a rate of $0.144/kWh. The USA, which is coal based, has a mean rate of $0.095/kWh. Canada, which is mostly hydroelectric is one of the lowest at $0.068/kWh; another hydroelectric nation, Norway, comes in at $0.071/kWh. All of these numbers will include associated transmission costs. When we use the growth curves shown previously in Figure 1 with our equation for price, we find that the cost of PV drops below that of conventional electricity generation startlingly fast (Figure 3).
 Figure 3: Cost of photovoltaic electricity for Stuggart and Los Angeles versus baselines
for France (nuclear-based), USA (coal-based), and Canada (hydroelectric-based).
Interestingly, the location of photovoltaics has little impact on their price over the long term. Rather it is the industy's growth rate which dictates the future price. One might be curious as to where the price point might be when the industry saturates.
The actual price decline of PV has stalled over the past year and a half. Essentially what happened is the PV industry eclipsed the microelectronics industry in terms of silicon consumption before thin-film silicon technologies were ready for commercial production. As a result, there's been a bit of a lag as silicon producers catch up to demand. I do not think that this will continue to be a problem, as I will explain below.
Economic Incentives
One of the issue with photovoltaics is that as an emergent technology it isn't cost competitive with fossil fuels today. However, subsidy programs by governments of Japan and Germany have been generating tremendous demand growth by making solar cost competitive. Recently more jurisdictions have put forth subsidy programs, such as California, New Mexico, Ontario, Spain, Italy, and Portugal. One obvious question in looking at the exponential growth curves in Figure 1 is, "Just how much is all of this going to cost?" Combining the equations for the learning rate with the growth rate provides us with an answer.
 Figure 4: Annual cost to subsidize entirety of world PV production to a
rate of $0.05/kWh under 33 % annual growth scenario.

The total cost of these subsidies run to about US$90 billion for the 33 % growth model and US$154 billion for the 25 % model until the price of solar power drops below the desired $0.05/kWh. It's not an insignificant amount of money, but neither is it a particularly onerous cost for transforming our energy structure; the USA alone budgets $24 billion a year to the Department of Energy.
It's probably worth noting that return rate is over one trillion dollars a year by 2031 against the $0.05/kWh baseline. This can be construed either as potential tax revenue or additional income that will be contributed to GDP.
Intermittency
Intermittency is the problem that renewable energy sources suffer from due to the natural fluctuations of their power source. Any transmission grid that relies on renewable sources as a primary input will require a substantial amount of storage, deferrable demand, or load-following spare capacity. The severity of intermittency can be thought of as a combination of its predictability, correlation to demand, and variance. Compared to its chief competitor, wind, solar is far more predictable. One can be assured of the position of the sun in the sky every day with the mitigating factor being cloud cover. However, integrated over a large area the portion of the sky covered with cloud can be reliably estimated. In comparison, wind velocity is nearly impossible to predict. It also correlates relatively well to the natural daily peak in demand, for a noisy real-world system. The variance of wind and solar are roughly equal, which is a little surprising given the dinural cycle of night and day that solar has to deal with. In addition to their daily variance both solar and wind are subject to seasonal variations.
It is my opinion that the concern over intermittency of solar power is exaggerated. This is due to the fact that the learning rate of photovoltaics dictates that the cost of solar will fall below that of the main established sources of power (coal, nuclear) well before solar will constitute a significant fraction of our energy consumption. I think most people will agree, when the price of solar energy drops below that of the competition, the game changes. When you have power to burn, simple and low-capital techniques of storing or transmitting solar electricity become practical. At $0.05/kWh solar would have a margin of $0.04/kWh or more to work within for charging electric vehicles, filling deferrable demand, storage techniques such as Vanadium redox batteries, or long distance high-voltage direct-current transmission.
Resource Limitations
One of the factors limiting photovoltaic growth at the moment is a shortage of electrical-grade refined silicon. Silicon itself is not in short supply, being the second most abundant element in the Earth's crust after Oxygen. This limitation is likely to fall away as new cell designs that use less silicon are deployed commercially. Traditional cells are made by sawing a solid block of polycrystalline silicon and then polishing the surfaces. This results in a cell that is 300 μm with around 50-100 μm of material wasted. New techniques such as ribbon growth can reduce that figure to 100 μm. Furthermore, thin film silicon cells grown by chemical vapour deposition, such as Sharp's triple-junction cells, can achieve the same performance as polycrystalline cells with only 10 μm of silicon. As these techniques reach market penetration (ribbon growth is proprietary, thin-film techniques are not), they should reduce the strain on silicon refiners.
The other resource restriction is due to geographical limitations. Some renewable resources (hydroelectric, tidal) are tightly limited to certain terrain, such as tidal basins or river valleys. Wind is a somewhat more diffuse, but the best resources where the wind blows most strongly and consistently are still limited compared to humankind's energy consumption.
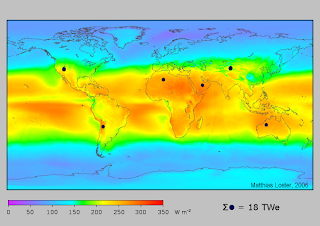 Figure 6: Global Solar Energy Abundance Map [6].
World insolation (incoming solar radiation) on the other hand is massive and relatively evenly distributed. The sun outputs 1026 watts of power and our tiny little planet intercepts about a billionth of that. Right now the human race consumes around 18 TW of energy, or 1/10,000th of what strikes the Earth. Roughly 1/3rd of that is useful work, the rest is lost to entropy. The 24-hour average insolation for the inhabited world spans 150-300 W/m2. That implies we would need 3.5-7 m2 of 10 % efficient panels per person, to supply all of our energy needs from solar power.
Personnel Shortfall
Running short of trained people in a rapidly growing industry is always presents a problem. Take, for example, nuclear engineers. There aren't many of them, training one takes about four years, and their skills are not easily transferred to other disciplines. The photovoltaics industry is similar enough to the microelectronics industry that they can trade personnel, however. The microelectronics industry has already built up strong education programs that photovoltaics can piggy-back.
If chemical vapour deposition (CVD) for thin-film silicon becomes the dominant production method, this still should not present too great a problem. CVD is a common manufacturing technique used for all sorts of coatings, such as tribological (hardness) coatings for tools, or even aluminized mylar. It's also used in microelectronics. It does happen to be more of an art then a science, which means that learning requires experience.
Ancillary Costs
Installing a rack of PV modules on a garage is not simply a matter of fixing them down with some twist-ties. Typically they need a metal frame so they present an optimum azimuth to the sun, they need electrical wiring, they need an inverter to transform DC to AC power, they may need a net-meter to sell power back to the utility, and of course, there's the labour required for installation. As many readers will know, there's quite an argument in California as to whether or not a licensed electrician is required for installations. One might also consider the 3 mm layer of glass (glazing) that protects the cells from hail also 'ancillary' although it is included in the sticker price.
The main question is whether or not ancillary costs have a similar learning rate to that of the modules themselves. My analysis has assumed that they do. We will probably see declines in the ancillary costs by better product integration and standardization. Rugged encapsulation combined with light-trapping surface patterning will probably slowly replace the standard glazing. Inverters should improve drastically both in terms of cost and lifespan. There's also always been the idea of incorporating solar cells into dual-use products, such as solar shingles or skylights.
Consumer Acceptance
Unlike just about every other source of electrical generation, photovoltaic power doesn't have any "Not In My Backyard" (aka NIMBY) issues. `Nuff said.
[2] W. Hoffmann, "PV solar electricity industry: Market growth and perspective", Solar Energy Materials & Solar Cells 90 (2006), pp. 3285-3311.
[3] A. McDonald, L. Schrattenholzer, "Learning rates for energy technologies", Energy Policy 29 (2001), pp. 255-261.
[4] RETScreen International Clean Energy Project Analysis Software, National Resources Canada.
[5] Electricity Prices for Households, Energy Information Administration, February 28,2007.
[6] Matthias Loster, Solar land area, Wikipedia.org, 2006.
Photovoltaic cells are not like any other method humanity uses to collect and use energy. Existing techniques extract energy either from mechanical motion (wind, hydroelectric, tidal) or heat differentials (fossil fuels, nuclear, solar-thermal). Whereas all these systems produce useful work by the turning of a shaft photovoltaics convert sunlight directly into direct-current electricity. While photovoltaics are still beholden to the laws of thermodynamics and entropy, the difference still implies that they abide by difference rules. In particular, they have a total absence of moving parts and as a result are almost free of maintenance requirements. Photovoltaic cells degrade in performance only very slowly as they are bombarded by cosmic rays. Most manufacturers offer warranties that guarantee they will still reach 80 % of their rated power output after 25-years.
Photovoltaic Share of the Energy Pie
A report by Merill Lynch (Hat-tip to Clean Break) found that between 2200-2500 MWpeak worth of solar cells were manufactured in 2006 [1]. Taking the median value of 2350 MWpeak and a capacity factor (cf) of 0.2, which is typical, then the annual electricity capacity was 4 million kWh. According to the Energy Information Administration (US DoE), the world produced 16,400 billion kWh of electricity in 2004, and that figure is growing at 3.2 % a year since 1994. If we extrapolate to 2006 at 4 % growth then the total electricity production was an estimated 17,950 billion kWh. Photovoltaic power consists of only about 0.6 % of the annual growth in electricity capacity.It seems minute, and it is, for now. However, solar production hasn't been growing at 3.2% per year. It has, in fact, been growing at 33 % per annum for the last decade [2], and it's expected to continue that trend for the immediate future. The cumulative installed capacity can be expressed as
C(t) = Co e(γ-δ)(t-to)/(γ-δ)where C(t) is the cumulative installed PV electricity generation capacity, Co is the initial installed capacity, γ is the growth rate, δ is the degradation rate (10 % efficiency loss every 12.5 years or 0.008), and t is of course the time in years. Nothing fancy here, just pure exponential growth.

Figure 1: Scenarios for PV cumulative installed capacity as compared
to worldwide demand growth of 4 % per annum over the next 25 years.
to worldwide demand growth of 4 % per annum over the next 25 years.
As one can see from Figure 1, while the impact of solar may be trivial now, it will not be over the next 25 years. If solar can maintain the same growth rate is has for the past decade, solar can supply all of mankind's projected electricity demands 26 years from now.
Cost of Photovoltaic-derived Electricity
Generally speaking the cost of any technology declines with production capacity according to a power-logarithm law,P(t) = Po ρlog2( Exp( γ (t-to) )where P(t) is the price as a function of time, Po is the initial price, ρ is the learning rate, and C(t) is the capacity. Historically, ρ for photovoltaics has been very stable around 0.8 which corresponds to a learning rate of 20 % as depicted in Figure 2.

Figure 2: Learning rate for photovoltaic panels (reprinted from [3]).
The learning rate of photovoltaics is much higher than that of other energy technologies. In fact, it's more in-line with things like computers or DVD players. This fact should surprise no one; as I mentioned in the introduction, photovoltaics are different from all other forms of energy production. The small incremental nature of photovoltaics is a major advantage from a R&D perspective, as I've described previously. While coal and nuclear power plants are installed in increments of hundreds or thousands of megawatts, solar panels are measured in the hundreds of watts. Thus while a design change to a nuclear power plant can take a decade or more to manifest itself, solar manufacturers can do this in weeks. As a result, photovoltaic technology will go through hundreds of design revisions in the time it takes coal or nuclear plants to go through one. Some learning rates for various technologies are listed in Table 1. One thing to take from the table is not only that photovoltaics have a superior learning rate, but that they also have so much further to grow.
Table 1: Historical Learning Rates for Electricity Producing Technologies (extracted from [3]).
| Technology | Learning Rate (%) | Correlation (R2) | Sample Period (years) |
| Coal | 7.6 | 0.90 | 1975-1993 |
| Nuclear | 5.8 | 0.95 | 1975-1993 |
| Hydroelectric | 1.4 | 0.89 | 1975-1993 |
| Gas Turbines | 13 | 0.94 | 1958-1980 |
| Wind | 17 | 0.94 | 1980-1994 |
| Photovoltaic | 20 | 0.99 | 1968-1998 |
| Laser Diodes | 23 | 0.95 | 1982-1994 |
Current panel costs are treading at around $4.80/Wp, and the various extras such as frames, labour cost an addition $2.50/Wp. I'll use two locations to establish a baseline for the cost of photovoltaic power: Stuggart, Germany and Los Angeles, USA. A Retscreen analysis shows that the Stuggard location produces 1.089 MWh/year /kWp (which represents a capacity factor of 0.17) and LA produces 1.605 MWh/year /kWp (capacity factor 0.25). Simulations in RETSCREEN find that amortized over 25 years these locations can produce power at $0.24/kWh in Stuggart and $0.21/kWh in California [4]. Financial assumptions are: energy inflation is equal to monetary inflation, interest is 1.0 % above prime (government rates).
World residential electricity prices are generally lower than this [5]. France, which is primarily nuclear, has a rate of $0.144/kWh. The USA, which is coal based, has a mean rate of $0.095/kWh. Canada, which is mostly hydroelectric is one of the lowest at $0.068/kWh; another hydroelectric nation, Norway, comes in at $0.071/kWh. All of these numbers will include associated transmission costs. When we use the growth curves shown previously in Figure 1 with our equation for price, we find that the cost of PV drops below that of conventional electricity generation startlingly fast (Figure 3).
 Figure 3: Cost of photovoltaic electricity for Stuggart and Los Angeles versus baselines
for France (nuclear-based), USA (coal-based), and Canada (hydroelectric-based).
Interestingly, the location of photovoltaics has little impact on their price over the long term. Rather it is the industy's growth rate which dictates the future price. One might be curious as to where the price point might be when the industry saturates.
The actual price decline of PV has stalled over the past year and a half. Essentially what happened is the PV industry eclipsed the microelectronics industry in terms of silicon consumption before thin-film silicon technologies were ready for commercial production. As a result, there's been a bit of a lag as silicon producers catch up to demand. I do not think that this will continue to be a problem, as I will explain below.
Limitations to Growth
For one to look at the curves in the previous sections, and believe that they are achievable then assurances that there won't be too many roadblocks in the future. This section will take a closer look at potential issues that could slow the growth of the photovoltaic industry.Economic Incentives
One of the issue with photovoltaics is that as an emergent technology it isn't cost competitive with fossil fuels today. However, subsidy programs by governments of Japan and Germany have been generating tremendous demand growth by making solar cost competitive. Recently more jurisdictions have put forth subsidy programs, such as California, New Mexico, Ontario, Spain, Italy, and Portugal. One obvious question in looking at the exponential growth curves in Figure 1 is, "Just how much is all of this going to cost?" Combining the equations for the learning rate with the growth rate provides us with an answer.
Psubsidy = (Po ρlog2( exp() ) - 0.05)* C(t-to) e(γ-δ)(t-to) / (γ-δ)This assumes that existing installations are amortized at the same rate as the price of new modules drops. This is not a bad assumption simply due to the massive growth rate, which has a doubling time of 2.1-2.7 years.
 Figure 4: Annual cost to subsidize entirety of world PV production to a
rate of $0.05/kWh under 33 % annual growth scenario.

Figure 5: Annual cost to subsidize entirety of world PV production to a rate of $0.05/kWh under 25 % annual growth scenario.
The total cost of these subsidies run to about US$90 billion for the 33 % growth model and US$154 billion for the 25 % model until the price of solar power drops below the desired $0.05/kWh. It's not an insignificant amount of money, but neither is it a particularly onerous cost for transforming our energy structure; the USA alone budgets $24 billion a year to the Department of Energy.
It's probably worth noting that return rate is over one trillion dollars a year by 2031 against the $0.05/kWh baseline. This can be construed either as potential tax revenue or additional income that will be contributed to GDP.
Intermittency
Intermittency is the problem that renewable energy sources suffer from due to the natural fluctuations of their power source. Any transmission grid that relies on renewable sources as a primary input will require a substantial amount of storage, deferrable demand, or load-following spare capacity. The severity of intermittency can be thought of as a combination of its predictability, correlation to demand, and variance. Compared to its chief competitor, wind, solar is far more predictable. One can be assured of the position of the sun in the sky every day with the mitigating factor being cloud cover. However, integrated over a large area the portion of the sky covered with cloud can be reliably estimated. In comparison, wind velocity is nearly impossible to predict. It also correlates relatively well to the natural daily peak in demand, for a noisy real-world system. The variance of wind and solar are roughly equal, which is a little surprising given the dinural cycle of night and day that solar has to deal with. In addition to their daily variance both solar and wind are subject to seasonal variations.
It is my opinion that the concern over intermittency of solar power is exaggerated. This is due to the fact that the learning rate of photovoltaics dictates that the cost of solar will fall below that of the main established sources of power (coal, nuclear) well before solar will constitute a significant fraction of our energy consumption. I think most people will agree, when the price of solar energy drops below that of the competition, the game changes. When you have power to burn, simple and low-capital techniques of storing or transmitting solar electricity become practical. At $0.05/kWh solar would have a margin of $0.04/kWh or more to work within for charging electric vehicles, filling deferrable demand, storage techniques such as Vanadium redox batteries, or long distance high-voltage direct-current transmission.
Resource Limitations
One of the factors limiting photovoltaic growth at the moment is a shortage of electrical-grade refined silicon. Silicon itself is not in short supply, being the second most abundant element in the Earth's crust after Oxygen. This limitation is likely to fall away as new cell designs that use less silicon are deployed commercially. Traditional cells are made by sawing a solid block of polycrystalline silicon and then polishing the surfaces. This results in a cell that is 300 μm with around 50-100 μm of material wasted. New techniques such as ribbon growth can reduce that figure to 100 μm. Furthermore, thin film silicon cells grown by chemical vapour deposition, such as Sharp's triple-junction cells, can achieve the same performance as polycrystalline cells with only 10 μm of silicon. As these techniques reach market penetration (ribbon growth is proprietary, thin-film techniques are not), they should reduce the strain on silicon refiners.
The other resource restriction is due to geographical limitations. Some renewable resources (hydroelectric, tidal) are tightly limited to certain terrain, such as tidal basins or river valleys. Wind is a somewhat more diffuse, but the best resources where the wind blows most strongly and consistently are still limited compared to humankind's energy consumption.
 Figure 6: Global Solar Energy Abundance Map [6].
World insolation (incoming solar radiation) on the other hand is massive and relatively evenly distributed. The sun outputs 1026 watts of power and our tiny little planet intercepts about a billionth of that. Right now the human race consumes around 18 TW of energy, or 1/10,000th of what strikes the Earth. Roughly 1/3rd of that is useful work, the rest is lost to entropy. The 24-hour average insolation for the inhabited world spans 150-300 W/m2. That implies we would need 3.5-7 m2 of 10 % efficient panels per person, to supply all of our energy needs from solar power.
Personnel Shortfall
Running short of trained people in a rapidly growing industry is always presents a problem. Take, for example, nuclear engineers. There aren't many of them, training one takes about four years, and their skills are not easily transferred to other disciplines. The photovoltaics industry is similar enough to the microelectronics industry that they can trade personnel, however. The microelectronics industry has already built up strong education programs that photovoltaics can piggy-back.
If chemical vapour deposition (CVD) for thin-film silicon becomes the dominant production method, this still should not present too great a problem. CVD is a common manufacturing technique used for all sorts of coatings, such as tribological (hardness) coatings for tools, or even aluminized mylar. It's also used in microelectronics. It does happen to be more of an art then a science, which means that learning requires experience.
Ancillary Costs
Installing a rack of PV modules on a garage is not simply a matter of fixing them down with some twist-ties. Typically they need a metal frame so they present an optimum azimuth to the sun, they need electrical wiring, they need an inverter to transform DC to AC power, they may need a net-meter to sell power back to the utility, and of course, there's the labour required for installation. As many readers will know, there's quite an argument in California as to whether or not a licensed electrician is required for installations. One might also consider the 3 mm layer of glass (glazing) that protects the cells from hail also 'ancillary' although it is included in the sticker price.
The main question is whether or not ancillary costs have a similar learning rate to that of the modules themselves. My analysis has assumed that they do. We will probably see declines in the ancillary costs by better product integration and standardization. Rugged encapsulation combined with light-trapping surface patterning will probably slowly replace the standard glazing. Inverters should improve drastically both in terms of cost and lifespan. There's also always been the idea of incorporating solar cells into dual-use products, such as solar shingles or skylights.
Consumer Acceptance
Unlike just about every other source of electrical generation, photovoltaic power doesn't have any "Not In My Backyard" (aka NIMBY) issues. `Nuff said.
Conclusions
Many people will look at the graphs in disbelief that the easy path photovoltaic power has been travelling can continue. All I can really say in reply is, those are the historical numbers. The learning rate is exceptionally stable. The growth rate has been, if anything, accelerating in the face of a industry silicon shortage. Thin-film technologies seem well positioned to cause the price to continue to fail into the near future. Solar power doesn't have very far to fall in many European nations before it's cheaper than residential rates. As residential solar becomes the cheapest power available that will continue to push demand upward and fuel growth. There's nothing obvious to me that says 'Stop' in solar's future and it's a fact of exponential growth that the early years matter the most. Even if the growth rate drops 1 % a year over the next 25-years the eventually outcome seems predetermined, it's just a question of the timing.References
[1] S. Pajjuri, M. Heller, Y.S. Tien, I. Tu, B. Hodess, "Solar Wave - Apr-07 Edition" Merill Lynch (2007).[2] W. Hoffmann, "PV solar electricity industry: Market growth and perspective", Solar Energy Materials & Solar Cells 90 (2006), pp. 3285-3311.
[3] A. McDonald, L. Schrattenholzer, "Learning rates for energy technologies", Energy Policy 29 (2001), pp. 255-261.
[4] RETScreen International Clean Energy Project Analysis Software, National Resources Canada.
[5] Electricity Prices for Households, Energy Information Administration, February 28,2007.
[6] Matthias Loster, Solar land area, Wikipedia.org, 2006.
01 May 2007
ecoAction: Real or Greenwashing?
Several months ago the minority Conservative federal government of Canada made a big gear-change and overhauled their environmental policy. Gone were the efforts to suppress the validity of climate change science, and in came a six-point plan encapsulated as ecoAction. The six components are based on: a biofuels initiative, a new bill on toxic chemicals and a similar clean air act for airborne pollutants. In addition there was two grab-bag programs for transportation (ecoTransport) and residential/commercial/industrial (ecoEnergy), as well as a trust-fund to fund specific programs in the individual provinces. With such 'eco' branding, my natural reaction was to assume it was a major green-washing program. Closer examination reveals a little more beef (or pork, as the program goes).
Politically, I think this sea change was arrived at for a variety of reasons. One certainly has to be the nomination of Stephen Dion as leader of the Liberal Party. Dion was previously the environment minister in the previous government and an active supporter of Kyoto and a carbon tax. The conservative greening stole much of his thunder.
Furthermore, Harper has long been accused of pushing Canada conservatism towards neo-conservative tenants. On issues such as the environment and personal freedoms they were moving out of touch with their base; As a result, they seem to have been losing votes to the Green party, which is now polling around 9-12 % nationally and gaining substantial support in rural Alberta. I think the Conservative government grew concerned with changing demographics and that their policies were risking freezing out support for them from important special interest groups. The change appeared to me to be signaled when the government moved away from the US administration and sharply criticized them over Maher Arar and his deportation from the USA to Syria and subsequent torture. Right now they are facing all sorts of trouble over insufficient oversight of Afghan prisoners handed over to the Afghan government.
In addition, political party donations from corporations has been sharply curtailed following the patronage scandals that saw the Liberal party fall from grace. That in turn will signal a welcome strengthening of the importance of individual citizens for fund raising purposes. Nor is corporate opposition to Kyoto uniform. A number of corporate leaders want some form of climate change legislation to help indemnify them from the associated liabilities.
Also, we must remember that the Conservatives are in a minority position in parliament, and much of this could be a fig leaf to gain the support of the New Democratic Party on other issues, such as the intervention in Afghanistan.
Environmental Trust
The biggest budgetary item is an environmental trust fund that is disbursing funds to the provinces, at $1.5 billion per year. To a certain extent, this is a reflection of the decentralized nature of governance in Canada. After all, the provinces are the ones with the control over electrical power generation. Basically it appears to be providing matching funds with a healthy dose of pork. For example, British Columbia is receiving funds for, "Support for the development of a, “hydrogen highway,” a network of hydrogen fueling stations for fuel celled buses and vehicles;" which is unsurprising given the presence of a (struggling) fuel cell industry in the province. Similarly, Alberta's focusing its efforts on oxymoronic 'clean coal' and sequestration.
Biofuels
The biofuel initiative appears to be an example of pure pork, with $200 million in subsidies to ethanol and biodiesel producers and $145 million for research, probably centered around cellulosic ethanol (-cough- Iogen -cough-). The goal is E5/B5 by 2010.
Chemical Regulation
Environment Canada has been engaged in a program since 1999 to categorize a wide variety of chemicals used in industry and to produce goods for human consumption to gauge how hazardous they are. Chemicals are categorized on whether they are persistent and bioaccumulative. Essentially, the database is at the point now where they can start implementing some regulations to insure bad chemicals are properly handled or not at all. I don't think there's any serious opposition to this plan except from some of the giant chemical producer multinationals.
Airborne Pollution
The original clean air act of the conservatives did not contain significant regulations on CO2 emissions. Instead, it mostly was oriented around regulating smog and particle pollution. The opposition parties conspired to insert an amendment that would force the government to meet Kyoto-treaty targets. This caused a great deal of political posturing on both sides of the aisle, as I talked about previously.
The Conservatives then turned back around and came up with their own plan: a 20 % reduction in greenhouse gas emissions (from 2007 levels) by 2020. It's hard not to notice how similar these numbers are in terms of timescale and reduction to Kyoto, but with everything pushed forward a decade. Kyoto originally came into effect in 1997, when the Liberals were in power.
I have not yet had the time to review this piece of legislation, but criticism has been fierce. If we ignore the political attacks, one of the most vitriolic critics is David Suzuki, who has every right to vent criticism. He essentially seems to think that the act is a sham. Al Gore has also been critical, pointing out that the bill language contains references to 'intensity reductions'. The idea behind 'intensity reductions' is that greenhouse gas producing industries are allowed to produce as much as they can sell, but they have to improve the efficiency of their processes. I.e. for every ton of aluminium you smelt, or bitumen you refine, you need to progressively improve the efficiency of the process. I'm a little of two minds on this: for one, this seems like a weasel way out. On the other hand, it seems logical that we should place the onus for reducing consumption on consumers and not producers. I'm sure once I have an opportunity to read the legislation I'll have more to say but as of today the government's website still is carrying the old version of bill C-30.
Transportation
The ecoTransport program appears to establish or repackage a number of public outreach programs surrounding public transport, personal automobiles, and commercial fleets. More importantly, it also contains a feebate program. Fuel efficient vehicles will receive a rebate of $2000 - $1000 depending on their efficiency numbers. There is a separate category for trucks, which will limit the effectiveness of the program. Much less publicized is an excise tax on gas-guzzlers. It's not a terribly aggressive tax but it does slap the Nissan Armada for $3000 and Hummer H3 for $2000.
Unfortunately, this program is hurt by the fact that E85 flex-fuel vehicles will also receive a $1000 rebate. It simply isn't possible to fuel a vehicle in Canada with E85 and it stands to reason that you never will (noting the biofuels initiative goal of E5 by 2010). Even if you think the energy return on ethanol is positive, it's extremely unlikely that supply will ever be sufficient to exceed E10; I don't see the point in paying GM to install ethanol-compatible hardware in their cars to compensate them for their piss-poor fuel economy engineering and design choices.
Another substantial policy change for ecoTransport is a $150 tax credit towards the purchase of public transit passes. This does two things: it helps reduce the relatively high marginal cost of riding public transportation rather than driving an existing car, and more importantly it gives the student councils at universities and colleges an effective tool to continue to push forward with universal transit pass schemes. I'm certainly a believer in getting students to ride transit early in their lives before they become habituated towards driving everywhere and grow fat.
Energy Efficiency
The ecoEnergy program is mostly composed of energy efficiency programs. However, there is a 1 ¢/kWh, 10-year subsidy for renewable power. This subsidy has a minimum entry level of 1 MW with fixed capacity factors, so it's not going to be applicable to solar cells on the roof of someone's garage.
The most important items, from the prospective of Joe Average, are the grant programs for home efficiency, solar-thermal water and space heating. There's up to $5000 (at a 25 % subsidy) available towards home retrofits and $300-1600/m2 for solar water heating systems (evacuated tube collectors being the high end). Unfortunately, there does not appear to be a specific program for ground-source heat pumps. A lot of construction in Canada still has baseboard electric heating, and in a subzero winter environment the ground-source heat pump is the most efficient solution but it comes with a big attached capital cost.
On the issue of energy efficiency of various appliances I feel that more could be done. There have been a pair of amendments to energy efficiency standards recently by the Conservative government but they mostly add more categories (i.e. wine chillers) than apply some meaty standards for the big consumers, like air conditioners and refrigerators. Also, how about a labeling requirement for vampire electric power consumption? A new development that is related to this proposal is a proposed ban on incandescent lighting by 2012.
Conclusion
On the question of genuine or greenwashing, I think the ecoAction program comes down on the genuine side. There's pork, there's loopholes (E85 cars), there's questionable methodology ('intensity reduction'), but there's also a ton of good stuff with billions of real money allocated towards it.
Energy Trust grade: B-
Biofuels Initiative grade: C+
Chemical Substances grade: A-
Clean Air grade: incomplete
ecoEnergy grade: B
ecoTransport grade: B
ecoAction overall grade: B
Overall, from a policy wonk perspective, the mechanisms seem solid and comprehensive. This package covers a lot of new ground so there is bound to be a lot of niggling criticisms from all corners of the political spectrum; I don't see the need to protest too much. I also think that this policy, as it is derived from the Conservative party, is a worth more than it seems on first inspection. The goalposts have been moved along the green-brown line, and that's a helpful thing.
The reason why I don't grade it any higher is simply due to the lack of zeal. It's true that Canada previously had little in the way of federal environmental or energy policy. It's also true that most citizens can only accept change so quickly. However, I think it's clear that a lot of the dollar values could easily be doubled. For example, a public transit pass costs $30-45 a month, whereas the government is only offering a $150 annual tax deduction. How would we pay for these programs you ask? Well, through the $20/ton carbon dioxide tax that the government doesn't want to implement of course.
Subscribe to:
Posts (Atom)