The Fourier transform is a technique used in signal processing, statistics, and a host of other applications to determine the periodicity of a signal. It essentially tries to fit a very large number of sinusoidal waveforms to a provided signal (like wind velocity data) to see if there are any periodic elements. I did exactly that to the wind data I used previously.
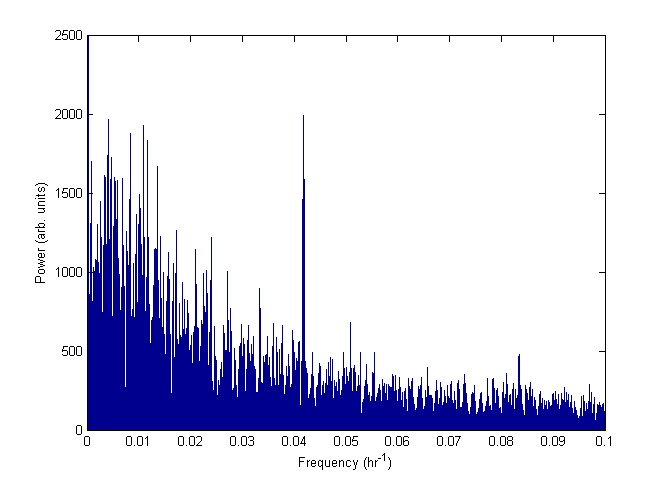 Figure 1: Periodogram of sample wind data provided for Block Island, RI
 by HOMER software package.
This shows part of the problem associated with trying to simulate wind data. If I tried to use 'white' noise to simulate wind I would get a wrong result. White noise is evenly composed of all frequencies and hence the Fourier transform should provide a straight line. Wind appears to be more likely 'red' or 'brownian' type noise. See Wikipedia for definitions of types of noise.
The other thing I should look at is the autocorrelation of the data. Unfortunately I can't do that (easily) from school.
No comments:
Post a Comment