31 May 2006

Solar Powered Car Nonsense

EnergyPulse, home of a numerous dubious articles on the energy front, has a new article promoting hybrid cars with integrated solar panels (hat tip: Jim Fraser's Energy Blog). There's some confusion between Jim's post and the EnergyPulse article: Jim assumes EnergyPulse is talking about plug-in cars but EnergyPulse doesn't actually claim that the hypothetical solar hybrid car has a plug-in capacity in the analysis portion of the article. Maybe EnergyPulse thinks you would only plug-in at home or something, I don't know.

The article suggests that mounting a 150 Wpeak panel (nominal surface area of 1.2 m2 at 12.5 % efficiency) on a car will have a much better financial payback because rather than produce cheap grid electricity it replaces heavily taxed motor fuel. The confusion regarding the plug-in capacity of the vehicle becomes important at this stage: doesn't it make more financial sense to fill up the car with cheap coal electricity from the grid and just skip the solar altogether?

The first problem that we encounter is a claim that a Prius can travel 7 miles on 1 kWh of electrical charge. This number equates to 8.88 kWh/100 km, which is not realistic. Ben at theWatt.com has compiled some of the Environmental Protection Agency numbers and the best is for the Nissan Altra EV at 17 kWh/100 km.

The next problem is that the author assumes that the capacity factor for a car mounted solar panel will be the same for a fixed mount on a building. The obvious problem is that a panel mounted horizontally on the roof isn't going to be at an idea angle to collect insolation. Furthermore, cars spend the vast majority of their lives parked. What happens if you happen to park in the shade of a high-rise or a tree; park it in a garage or parkade? Photovoltaics don't do well if they are even partially shaded, since it leads to reverse current in the shaded sections that degrade the performance of the system as a whole. Basic trigonometry suggests that if you're in Los Angeles (33 ° N latitude) then a horizontal panel should only see cos( 30 ° ) = 0.866 as much radiation. In actual fact, due to the higher insolation in the summer, RETScreen says that the horizontal panel in LA will produce 271.5 kWh/year versus 297 kWh/year for one fixed at 33 ° to the horizontal. These correspond to a capacity factor of 0.2055 and 0.2260 respectively whereas the author assumed a capacity factor of 0.25 for both systems.

The real issue here is that a car-mounted small solar panel can't contribute even a small amount of the energy needed to actually move the car. Using HOMER (which allows hourly rather than monthly resolution) and solar data for LA in 2003 I found the total power generated by a horizontal PV panel to be 245 kWh/year (even lower than from RETScreen).
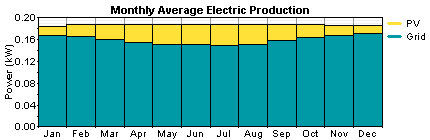
Figure 1: Cumulative Supply from on-board PV and grid power.

Because the PV panel can't supply enough energy to move the vehicle over short distances it makes no sense to invest in a battery pack if you don't also provide plug-in capacity. If you do provide plug-in capacity, why is it attractive to put the panels on the car rather than attached to the grid? If the solar panel on the car actually does fully charge the vehicle, it has no where to dump the power if it's not connected to the grid. It's not possible to simulate this case but obviously it's another argument against the concept. There are only one advantage to mounting panels on a car rather than on a grid-tied fixed mount: there's no DC-AC-DC conversion.

Let's try another tack: maybe the power provided by grid-tied panels couldn't be used while the vehicle is actually driving. E.g. the grid has no storage capacity and everyone unplugs for and at the exact same time. Let's presume that a vehicle drives an average of 20 km on electric power every day of the week. Using reasonable figures for consumption (20 kWh/ 100 km) that's 4 kWh a day. We'll presume that the battery can store 2.4 kWh and has a peak output of 75 kW (105 hp). Let's also presume that the car only moves between 8:00-9:00 am and 5:00-6:00 pm. We'll be nice and assume the car is not grid connected for the entirety of those hours.
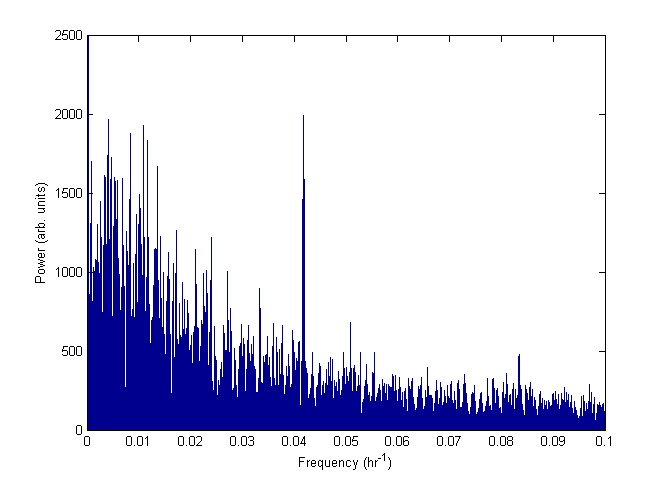
Figure 2: Hourly power demand and PV production
for four days in August.

What's the total power generated during the aforementioned commuting hours? 19.27 kWh or 8 % of the total power generated by the panels. Notice the obvious problem that this does nothing for you in the winter when you're driving in the dark.

So what's the point in putting panels on your car rather than your garage?

29 May 2006

Oil Price Futures

BBC is apparently running a documentary called "If... the Oil Runs Out" which posits the idea of $160/bbl oil by 2016. I wondered if this was just another prediction someone had pulled out of their ass or if it might actually be an extrapolation from the current trend. I know Stuart Staniford at the Oil Drum has been applying a least squares linear fit but I wanted to see what would happen if I extrapolated it over twenty years.

Since about 2002 the oil market seems to have existed in a state where production capacity has matched consumption. The result has been three and a half years of very steady growth in the price of oil as growing demand meets an insufficient supply. Previously Saudi Arabia had maintained a production capacity buffer that doesn't appear to exist anymore. If conditions stay largely the same the price should continue on its fairly steady climb.

As it happens based on my fit of oil price data the BBC's number seems pretty fair. A word on the source of prices: I used the EIA world average, which is not the same thing as NYMEX Brent or West Texas spot prices. Typically the actual price of oil is less than the oft-quoted market rate.

The growth in oil prices should break when one of two things happen: there is a decline in production, which could lead to a shock event as seen in the 1970s; or high prices cause destruction in the consumption and/or new projects begin to come online in 2007/8 and restore slack in the market for OPEC to use.

28 May 2006

I Decidered to Make the Energy Pie Higher

So... it looks like George W. Bush has switched gears on the issue of climate change, although there's some fuzzy logic involved. Apparently the 'how' isn't important − we wouldn't want to point any fingers at corporate donors − but we should get beyond whether or not CO2 causes global warming and just reduce the amount of man-made emissions.

I make no secret that I think that 30-40 % of our power mix needs to be stable baseload in order to have a chance of managing the intermittency of renewables. Hydroelectric power is not available in sufficient quantity outside of Canada and is too valuable as a scalable, load-following source of electricity to use as baseload. This leaves nuclear as the primary option for baseload. New reservoirs for dams are environmentally much more destructive than building nuclear reactors by any realistic measure.

If I was the Leader for the nukulear power industry I'm not sure I would want Bush speaking on my behalf. In fact, I think I would be running from Mr. 30 % Approval Rating as fast as my legs could carry me. Bush's record on bringing domestic programs to a successful end is not inspiring; one could almost say that anything he touches at this point becomes radioactive.

Last Wednesday Bush said that nukulear was "an overregulated industry." Sorry George, but laissez-faire is not an attitude that's applicable to nuclear. The worst attitude any nuclear engineer can maintain is the idea that an accident could never happen. From my experience with Atomic Energy Canada personnel that attitude is strongly discouraged although it doesn't stop them from being snarky towards anti-nuclear activists. Nuclear power can be outstandingly safe, but it requires vigilance, not faith.

The problem with the nuclear industry lobby as I see it is that they seem to see renewables as their competition. In reality, the competition to renewables is coal. Both coal and nuclear are basically means of powering a steam-turbine to produce electricity. Since they do not

While coal has gotten much cleaner and centralized since the days of London Fog that killed thousands of people it is still the dirtiest electricity producer around. Here's a list of pollutants you would see for emissions from a coal power plant: CO2, As, Cd, Cr, Cr-IV, Formaldehyde, Ni, Nitrates, NMVOC, NOx, Pb, PM10, PM2, PM2.5–10, SO2, Sulfates, Radionuclide emissions. Lead, arsenic, and chromium-IV are some of the nastiest pollutants around. The median for all of those from a nuclear power plant is zero.

The first reactor in the western world to be commissioned in quite a long time will probably be the European Pressurized Reactor in Finland, which was approved four years ago. Finland has good reason to do this: they import a lot of their electricity from a Russian RBMK reactor on the Kola peninsula. It doesn't take a genius to understand that taking the market away from RBMKs is a good idea. The Green party has come over to this viewpoint.

Nuclear reactors are constantly evolving thanks largely to construction projects in Asia.

As an aside, I should also direct people to Joel Achenbach's piece in the Washington Post Magazine on global warming skeptics. Achenbach is a humour writer, but there's only a few clever twists of phase in a overall neutral article.

26 May 2006

Closed-loop Biodiesel

I think Robert Rapier has made it explicitly clear that switching to biofuels with our current gas guzzling enterprise is largely a non-starter. I have said this in the past, "that we should not dismiss biofuels simply because their lobby groups are stupid." Biofuels provide very high utility due to the fact that they are high-density liquid fuels, ideal for long distance transportation. However, the paradigm needs to change: we need to get serious about both conservation and efficiency. We need smaller, lighter cars that incorporate all the efficiency advantages of hybrids and diesels. We also need to offset load to electricity rather than liquid fuels through the plug-in concept.

Over at the Oil Drum, Heading Out wonders why the big emphasis on ethanol from the USA corn farmers? You mean aside from their money-grubbing mendacity? As he points out biodiesel is a much better idea. The problem with ethanol obviously lies in distillation. I am not very high on cellulose ethanol either due to this simple problem. Separating the product from the water requires a whole lot of heat input.

Biodiesel is fatty acids which have been esterified by the addition of an alcohol, typically methanol. This greatly improves the flow properties of biodiesel compared to straight vegetable oil (triglycerides). Vegetable oil is relatively easy to separate from the plant. The most common method is to basically squeeze it out mechanically. This requires vastly less energy than distillation.

There is still the problem of the methanol input. My potential solution to this problem was to run an anaerobic reactor with the remaining material (i.e. cellulose) in order to produce methane. Methane production by anaerobic bacteria requires some very low grade heat inputs that could certainly be supplied by passive solar if the system was well designed and insulated. Producing methane is this fashion is relatively wasteful of the carbon you've managed to sequester -- the output is roughly half CH4 and half CO2.

However, the key point is that through this integrated approach there is no destruction of the soil nutrients. From an energy perspective it makes more sense to simply burn the dry biomass but then all your fertilizer becomes fly ash. In a methane reactor, the fixed nitrogen, phosphorous, and potassium will still be in the sludge left over once the bacteria are done with it. The sludge can be used as a fertilizer (with some soil issues). Overall it is a much more 'permaculture' solution than anything else I've seen.

The biodiesel/biogas approach is nearly a closed-loop. It produces diesel fuel and methane to power the farm machinery needed to grow the crop, and it also preserves the majority of the nutrients in the soil. Ethanol is constantly hammered because it essentially transforms natural gas into ethanol. It should be clear to everyone that if the integrated biodiesel/biogas approach isn't energy positive it simply won't be able to run.

In the past I haven't been able to find sufficient information to analyze this problem. I hope to take a second look at the issue and see if a reasonable back of the envelope approximation can be done now that there's so much more ethanol information out there.

20 May 2006

Solar Payback Period

Via Big Gav's Peak Energy blog one can see a reprint of discussion on the oft-repeated urban legend that photovoltaics don't produce more energy in their lifespan than they require to produce. This is, of course, a load of bunk that needs to be debunked. This might have been true in 1976, but not 2006; it isn't even remotely accurate to characterize photovoltaic technology as being so marginal.

The most recent study on the issue, is in fact brand new, using data from last year and published in March 2006 [1]. The study uses high quality industrial data to construct a picture of the embedded energy in photovoltaic modules themselves, their mounting frames, and the balance of system (BOS). This is not the type of back of the envelope calculations you might expect from my blog. Rather they are sophisticated accounts of the entire production process. An Excel spreadsheet is available in the public domain that illustrates the level of detail involved [2].

BOS represents the inverter and other ancillary equipment necessary for solar electric systems. The BOS numbers are based from the photovoltaic plant owned by Tucson Electric Power (TEP) Springerville, Arizona. The system performance is based on an average insolation of 1700 kWh m-2 yr-1 which is typical of Southern Europe. The rooftop systems have 25 % losses to the electrical system while the ground based system 20 %.

Figure 1: Payback time for complete photovoltaic systems for
polycrystalline Silicon and thin film Cadmium Telluride [1].

As you can see from the graph, the payback period is relatively short. Thin-film systems in general use less semiconductor material than crystalline silicon and hence have a lower embedded energy. The standard warranty for photovoltaic modules today is a guareentee that they will produce 90 % of their rated power after 12 years and 80 % after 25 years. The standard expectation is that they will continue to operate for 40 years, or more. After all, they are solid-state devices with no moving parts. Silicon and other solar cell materials form protective oxide coatings. Pretty much the only thing that can cause damage is bombardment by alpha particles and cosmic rays, which generates defects that act as electron-hole recombination centres.

Based on warranty information photovoltaic systems are guaranteed an energy return on energy invested greater than 10:1. The reason we don't see even more investment in solar electric, wind, and hydro-electric power projects has more to do with the large up-front capital costs than any concern over return rates. The EROEI of some dams in British Columbia has been estimated to be in the 100s, and will continue to grow for the rest of my lifetime.

Greenhouse gas emissions embedded in the production of photovoltaics is, as an obvious consequence, much lower than electrical generation by heat engines. The report by Fthenakis and Alsema finds the CO2 emissions of the polycrystalline-Si to be 37 g/kWh versus 400 g/kWh for natural gas or 900 g/kWh for coal.


Figure 2: Payback period for off-grade silicon cells
versus polycrystalline or amorphous silicon [3].

An earlier Japanese study on the issue came to a similar conclusion [3]. They also compared PV cells manufactured from the top and bottom of zone-refined ingots that is of lower quality than semiconductor grade silicon.

References

  1. Fthenakis, V. and E. Alsema (2006). "Photovoltaics Energy Payback Times, Greenhouse Gas Emissions and External Costs: 2004–early 2005 Status." Progress in Photovoltaics14(3):275-280.
  2. De Wild-Scholten M, Alsema E. "Environmental life cycle inventory of crystalline silicon photovoltaic module production" — Excel file, Report ECN-C–06-002, http://www.ecn.nl/library/reports/2006e/c06002.html
  3. Kato, K., A. Murata, et al. (1998). "An evaluation on the life cycle of photovoltaic energy system considering production energy of off-grade silicon." Solar Energy Materials and Solar Cells47(1-4): 95-100.

17 May 2006

The Scale of Solar Power

If we take a look at Sharp Solar with revenues of $1.5 billion last year and a 27 % market share, we can extrapolate a total market of $5.6 billion in photovoltaics for 2005. If you transform that from dollars to barrels of oil ($70/bbl) it's 80 million bbls. In other words, the solar industry has roughly the same value of a single day of world oil production. Solar power is a pretty dainty industry at the moment.

The solar cell production grew at 34 % in 2005 and 32 % in 2004 according to SolarBuzz. The annualized rate of growth in photovoltaics production has been 27 % over the past fifteen years (that's a doubling time of 2.56 years). All this growth is coming with tremendous pressure on silicon feedstock as noted by Sass Peress.

If photovoltaics keep growing at a 27 % annualized rate they'll exceed the world's annual oil revenue of today by 2028 (ignoring inflation).

13 May 2006

Peak Oil Taxonomy: the Doombat

[Insert David Suzuki's voiceover from "The Nature of Things"]

The Doomatinus Howlsatmoonicus, known by the colloquial name 'Doombat'. A newly discovered species, the doombat is an offspring of the `net denziens peak oil doomer and moonbat.

The moonbat's habitat is almost exclusively located in the contential USA due to their unique dietary requirements. Doombats sustain themselves through a unique combination of SUV exhaust, electronic emissions from omnipresent NSA wiretaps, and the stench of decaying Republicans.

Doombats are well known in the blogosphere for their fetish for tinfoil hats.


It's become pretty clear to me that technology is not the limiting factor in determining how civilization deals with peak oil as a phenomenon. How culture adapts to the increasing rarity of its favourite fungible energy resource has more to due with sociology than technology or geology. While we can't say anything about the reactions of the vast majority of citizens that aren't even aware of the concept, I think it would be interesting to build a graph of the taxonomy of peak oil blogosphere denizens. After all, what better way to offend a bushel of people than to arbitrarily histogram them and make specious claims about the composition of each bin?

There are four major sub-denizen groups in the peak oil blogosphere:
  1. Corncucopians
  2. Traditionalists
  3. Technopeakers
  4. Doomers

Corncucopians don't believe in any imminent peak in world oil production. They typically point to how under priced oil was in 1997 and how that had a major negative impact on investment, the lag of which is being felt today. Corncucopians further believe that with the application of higher average oil prices, unconventional sources (tar sands, deep water, shale oil, etc.) will become practical and come online after some similar lag period from the lows of 1997 to the highs of 2006. The stereotypical cornucopian is either an economist or oil industry worker and their experience and education leads them to this conclusion.

The population of corncucopians isn't very large because they tend to leave the blogosphere once their views harden. Without the anxiety over peak oil, there's little reason for them to stick around. There are some exceptions, namely the ones that enjoy baiting the doomer denizens (a.k.a. doomer baiting).


The traditional wing of peak oil denizens is primarily focused on the geology of Peak Oil: the when and the where. Traditionalists are unique in that they have a single home, namely The Oil Drum. Only doomers have anything like the community of traditionalists but they are still more diffused throughout the blogosphere.

Traditionalists can be subdivided into two basic groups: the patricians and the plebeians. The patricians of traditional peak oil provide the talking points, the graphs, and the philosophy of the sect. Traditionalist plebeians are concerned about peak oil but lack the confidence or expertise to form their own opinions on the subject. Instead they stroke the egos of their patricians and parrot their talking points. The plebeians are the driving force behind the unified front that traditionalists present − their positive reinforcement helps their patricians to stay on message.

While traditionalists greatly enjoy the frottage of predicting peak oil dates and decline rates, they suffer from the fact that the majority of data is either spurious or proprietary. This leads to a loss of credibility when predictions turn out to be false.

Traditionalists are the one species of peak oil denizens that focus effort on trying to raise awareness in the general citizenry. Any mention of the keywords "peak oil" in the mainstream media provokes and outburst of euphoria. In contrast any publication on energy issue that doesn't resolve around the ontology of peak oil receives heaps of scorn. This can be compared to the reaction of small countries being named by the major media outlets of the United States. E.g. " Canada's Steve Nash has been named the NBA's MVP for the second time." Canada: Oh my god, ABC said 'Canada' on the air; USA: turn on NASCAR.

The biggest failure on the part of the traditionalists is largely a lack of imagination. For example traditionalists will examine car fleet replacement rates and assume that they will remain steady in the face of rising oil prices. The patricians look to history for solutions to peak oil and them extrapolate from there: they see an upturn in the use of rail transport, a surge in coal consumption. History rarely repeats itself.


Technopeakers
can be roughly stereotyped into those with formal scientific or engineering training and the Wired crowd. The ones with formal education likely have at least read about basic thermodynamic principles and are less likely to physically impossible claims. The technopeakers are a diverse group. There are differences in opinion among pretty much every one with regards to issues like biofuels, nuclear power, renewables, etc. Because of this mélange of interests there is common dissent and in fighting among themselves that the outside world remains oblivious to; technophiles sometimes engage in the self-defeating tactic of the circular firing squad.

The loudest type of technopeaker is the one-shot Jonnys who fanatically believe in a magic bullet technological solution to cure all our ails. Nuclear fusion, hydrogen economy, and distributed solar power are all popular topics. Amory Lovins is probably the best known out of this group from his emphasis on conservation.

The biggest technophile group is the techo-optimists. These guys believe in peak oil but think that technology will save us. As such they tend to be pro-free market. Along with corncucopians, techno-optimists are the most likely blogosphere denizens to engage in doomer baiting.

The last major group is the techo-curmudgeons. Curmudgeons are the most likely group to have actual experience with R&D and tend to be grumpy and frustrated at the gamut of problems they encounter. They take an elitist view of the world and as a result are more likely than other technophiles to support government intervention because they don't trust the wisdom of the masses. Curmudgeons are often very number savvy but as a result they avoid any topic they have trouble quantifying because it's too much work. They likely point out the shortfalls of the technology they know the most about, and promote the technologies they know the least about due to their cynical worldview. This group includes me.

Doomers
spawn from the same fertile sediment as traditionalists but the two differ significantly on philosophy. Traditionalists tend to view the world as primarily altruistic while doomers view the world as primarily avaristic. This in turn colours how they believe people at large will react to shrinking oil supply versus growing demand. Doomers view oil as some kind of faustian substance and generally contrive to make logical connections that convince them that society will collapse when oil production peaks.

Doomer powerdowns are the most common and mildest Doomer subspecies. Their philoshopy is based on the singular assumption that the cost of cheap oil is embedded in everything and that rare oil will quickly make all modern economic activities impossible, regardless of their relative value to society. Powerdowners are very likely to correlate peak oil with peak energy. The end game for the powerdown sect is humanity reduced to 19th century technology and infrastructure. Anacedotally, powerdowners are the most likely members of the peak oil community to be suburbanites themselves with few practical skills outside the 3rd sector of the economy. Since they are more highly exposed than the rest of the world, they have correspondingly more anxiety about the consequences of peak oil.

Doomer nihilists take the powerdown scenario one step further to the die-off scenario and believe that the end of the oil age is here and the future will be an exact replica of the Mad Max movies until humans consume all oil and then promptly reach paleolithic age technology. To an extent they fuse the metality of 2K survivalists with the doomer culture.

Doombats, as described above, merge doomer and moonbat culture. Essentially they believe in the doomer precepts but transfer all the responsibility to George Bush, Big Oil, the Military-Industrial Complex, or whatever illuminati cabal they hold responsible for the ills of the world.

11 May 2006

Properties of Athabasca Bitumen and Boscan Ultra-heavy

I found an interesting table in the text 'Hydrocracking Heavy Hydrocarbon Feedstocks...', J.F. Kril & M. Ternan, 'Catalysis on the Energy Scene', Elsevier (Amsterdam) 1984.

Property

Athabasca Bitumen

Boscan Heavy Oil

Relative Density (15 °C)

1.009

1.016

Pitch 524 °C (wt %)

51.5

66.7

Conradson Carbon Residue (wt %)

13.3

16.7

Pentane insolubles (wt %)

16

22

Tolune insolubles (wt %)

0.7

0.1

Ash (wt %)

0.6

0.2

Components

Carbon (wt %)

83.4

82.4

Hydrogen (wt %)

10.5

10.4

Sulphur (wt %)

4.5

5.7

Oxygen (wt %)

1.0

0.5

Nitrogen (wt %)

0.4

0.8

Iron (ppm)

358

23

Vanadium (ppm)

213

1174

Nickel (ppm)

67

114


It seems that the Venezulian ultra-heavy oil from Boscan is in many ways actually worse than Alberta bitumen. I didn't know this; I assumed that the investment climate in Venezula was driving the preferrential development of Alberta tar sands.

09 May 2006

Statistical Analysis of Wind Data

Before I take a look at the Woods Hole data a commentor providing in my Proclivity of Wind post I wanted to take a last look at the structure of the sample wind data that I used from HOMER.

The Fourier transform is a technique used in signal processing, statistics, and a host of other applications to determine the periodicity of a signal. It essentially tries to fit a very large number of sinusoidal waveforms to a provided signal (like wind velocity data) to see if there are any periodic elements. I did exactly that to the wind data I used previously.
Figure 1: Periodogram of sample wind data provided for Block Island, RI
by HOMER software package.

A large portion of the data isn't periodic so there's a big spike at 'zero' frequency that can't be seen on this scale. Essentially this corresponds to the direct-current component of the signal. Interestingly, the strongest components appear at relatively low frequencies (and hence long periods of time). Hence we can see seasonal variations present but there's not much help here for the concept of predicting wind speed variations on an hour to hour timescale. There is a strong peak at the frequency of 0.041718 hr-1, which corresponds to a period of 24 hours. The graph extends out to a frequency of 0.5 hr-1 but it shows nothing so I shortened the scale.

This shows part of the problem associated with trying to simulate wind data. If I tried to use 'white' noise to simulate wind I would get a wrong result. White noise is evenly composed of all frequencies and hence the Fourier transform should provide a straight line. Wind appears to be more likely 'red' or 'brownian' type noise. See Wikipedia for definitions of types of noise.

The other thing I should look at is the autocorrelation of the data. Unfortunately I can't do that (easily) from school.

07 May 2006

Compact Fluorescent Review

I bought some Phillips "Daylight" 15 W compact fluorescents for my kitchen and I can't say I'm overly thrilled with them. My existing lights are all 13 W Silvania lights that are well known for their pink tint; they operate at a lower temperature than most fluorescents and have a slightly different emission spectrum. The "Daylight" models are supposed to better mimic the sun. I assumed that they added some phosphors to the glass. I'm not sure that I can tell any difference from them versus a traditional 2900 K fluorescent tube. They Phillips bulbs produce unsightly high contrast shadows -- the dreaded gray wall syndrome.

The other problem is that they emphasize the pink tint of my other lights -- something that I otherwise had an easy time not noticing. On the plus side the Phillips lights are silent. My Sylvania's do emit a hum from their iron transformer.