System Specifications
I decided to design a system with a constant demand of 26 MW. That power can be supplied either by 100 WES30 (a Dutch manufacturer) wind turbines (each rated at 260 kW) or a 26 MW monolithic gas turbine with a peak efficiency of 46.0 %. However, the efficiency of the system declines at lower loads [Figure 1]. Figure 1: Efficiency versus load for gas turbine.
Typically we would expect a capacity factor of about 20 % for wind turbines. This correlates to a 20 % penetration of the energy supply by wind in my example, a commonly held 'threshold' for where we expect to see significant problems emerge.
 Figure 2: Turbine power output versus wind speed. Cuts out at about 4 m/s and feathers at 260 kW and 18 m/s.
Turbine output is similarly variable with wind speed [Figure 2]. Notice that the wind turbine with the 300 kW rating maxes out at 260 kW. The hourly wind data is for Block Island, RI, USA (I would have preferred Cape Cod but I don't have any) with an average windspeed of 4.83 m/s.
In addition to the experimental case, I also designed a reference which was 100 % gas in order to compare the CO2 emissions and cost.
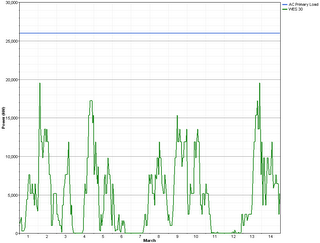 Figure 3: Hourly turbine output for two weeks in March (click to see larger image).
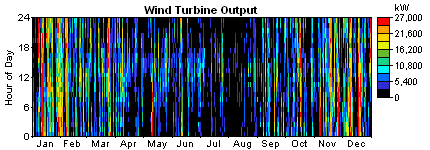 Figure 4: False-colour graph of wind power output as a function of time and date.
As we can see from [Figure 4] there is significant variation in the wind output both hour to hour and seasonally. Note the large black spots in the summer months; long periods of low power production are obviously a huge drawback if you are trying to use some sort of storage system like batteries. It implies you need a great big buffer. Alternatively, if you are trying to do load following with a gas turbine, you can't rely on any of the wind power being steady. In fact, you have to maintain the same power plant capacity with wind as you do without. All of the capital investment in wind needs to be offset through lower fuel consumption of fossil resources.
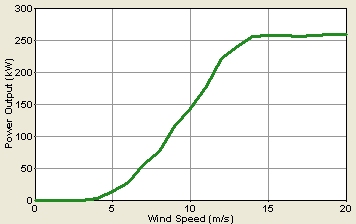 Figure 2: Turbine power output versus wind speed. Cuts out at about 4 m/s and feathers at 260 kW and 18 m/s.
Turbine output is similarly variable with wind speed [Figure 2]. Notice that the wind turbine with the 300 kW rating maxes out at 260 kW. The hourly wind data is for Block Island, RI, USA (I would have preferred Cape Cod but I don't have any) with an average windspeed of 4.83 m/s.
In addition to the experimental case, I also designed a reference which was 100 % gas in order to compare the CO2 emissions and cost.
Results
The wind turbines ended up meeting 21 % of the total demand with an average power output of 5.467 MW. Of course, the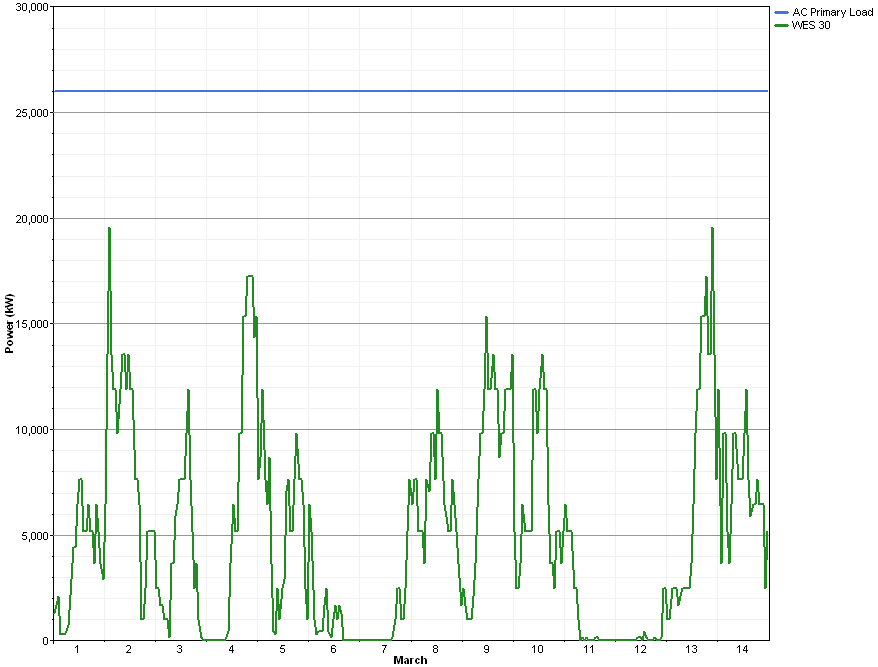 Figure 3: Hourly turbine output for two weeks in March (click to see larger image).
 Figure 4: False-colour graph of wind power output as a function of time and date.
As we can see from [Figure 4] there is significant variation in the wind output both hour to hour and seasonally. Note the large black spots in the summer months; long periods of low power production are obviously a huge drawback if you are trying to use some sort of storage system like batteries. It implies you need a great big buffer. Alternatively, if you are trying to do load following with a gas turbine, you can't rely on any of the wind power being steady. In fact, you have to maintain the same power plant capacity with wind as you do without. All of the capital investment in wind needs to be offset through lower fuel consumption of fossil resources.
Sources of Error
There are a number of issues I am glossing over here which favour either side of the argument. For wind power, I am calculating the power output for a single set of wind data. If turbines are geographically separated, they gain the advantage of sample averaging. The wind will tend to blow more steadily if averaged over a larger area.Against wind power, I am modeling demand as constant. This is quite wrong -- in fact the hourly and seasonal variations in electricity demand are quite substantial. This means that not only does the load-following gas turbine have to coup with the volatility of wind but also that of the consumer. One point of interest is that the gas turbine runs continuously -- it never has to stop -- which isn't realistic either.
Also, one should consider that the location of the wind turbine is quite important. Studies from the UK and Germany have come to widely diverging conclusions on the utility of wind. This is largely due to the differences in geography. The wind tends to blow more steadily in some areas. While companies may be picking their wind farm locations based on mean wind speed perhaps they should be just as concerned with the higher order statistical moments (variance, skewness, and kurtosis).
14 comments:
Very interesting. This is the first time I’ve seen anyone attempt this.
Wind speed data from sites closer to Cape Cod can be found at the Martha’s Vineyard Coastal Observatory site-
http://mvcodata.whoi.edu/cgi-bin/mvco/mvco.cgi
Or from the NOAA National Data Buoy Center- Buzzard’s Bay Station
http://www.ndbc.noaa.gov/station_page.php?station=buzm3
No, error is additive. I will explain in detail later, and I think I have references specifically for wind penetration at home.
The other source of error is that a real system will have more than one gas turbine, and superfluous turbines are likely to be turned off rather than run at idle.
This is an argument for real-time DSM, because a grid which can manage its load to exactly consume the output of un-schedulable production like wind will be able to minimize the low-power operation of gas turbines and other peaking generators.
You're taking too much from a simplistic analysis. The graph I gave only lists the instantaneous efficiency of the system, as if it's been running at that load since the beginning of the universe. As we all know, introducing transients doesn't make a heat engine happy.
If you have to constantly turn on and off sets of gas turbines that will have a great negative impact on their performance. You need to give them enough heat and inertia to get to their operating conditions. That's all wasted energy that Homer can't really account for. The wind data is only hourly. In reality wind oscillates much more frequently – corrections on the order of a minute are necessary.
There is a more detailed (and public domain) Irish study that can give a better feel for this:
http://www.sei.ie/index.asp?locID=330&docID=-1
Also consider the difficulty of running any combined cycle run on waste heat if the supply of heat isn't steady.
46% is rather low for a combined-cycle plant (a 30 MW GE simple-cycle gas turbine gets over 38%), so I had assumed that you were considering a peaking plant rather than base-load.
Wind fluctuates on a scale of minutes, but DSM systems which can make up the difference by juggling between A/C compressors and stored ice, water at the top of a water heater vs. the bulk of the tank, and (later) chargers for electric vehicles could manage this easily. If you have even 20 million PHEV's on 110 volt 15 A connections, you've got 33 GW of demand which is potentially controllable. That's only about 3.5% of total US generating capacity, but as a fraction of the minute-by-minute variation in supply I'm sure it's far more than that. Put them on 220 V 30 A connections or expand the total well past 10% of the vehicle fleet, and you're talking some serious impact.
Nick,
I wouldn't take that as gospel. You point on lack of geographical separation is moot. The correlation among wind speed at different farms in their modeling methodology is handled in an arbitrary fashion (see B.19). What's promising about the Ilex study is that it suggests that if you have strong forecasting techniques you can reduce the problems. Thus far wind forecasting is more voodoo than science.
Here is the 'other' Irish study from the power company (these are generally taken as a pair but I couldn't find this one last night):
http://www.eirgrid.com/EirGridPortal/uploads/Publications/Wind%20Impact%20Study%20-%20main%20report.pdf
This is actually the better study because they are the utility and have proprietary data. They have much more negative conclusions: 15 % cost increase in the price of electricity for only 11.7 % wind penetration and €120/ton cost for CO2 reduction. In comparison the Ilex study is quoting €0.50/ton. Those two numbers are difficult to reconcile. The Ilex number's don't account for capital costs (wheras the ESB study does estimate them).
The actual numbers should be somewhere in-between the two studies.
E-P:
That's nice, and I generally agree, but plug-ins and thermal storage are vapourware at this point. Similarly pumped/reservoir hydro can provide buffering from the supply side (and those systems actually exist).
I know that some of my former professors at UVic are working on the synergy between hydro and intermittent wind and wave power but I haven't seen publications as of yet.
Thermal storage is product.
Firstly, the assumption that adding wind power stops gas turbines working at maximum capacity is false, since generator capacity will be sized for peak demand, not average.
Secondly, all energy generators, including gas turbines, have downtime for maintenance etc, see
http://www.bwea.com/energy/rely.html
for some numbers. So the nominal total capacity has to be greater than expected peak demand anyway.
The way to reduce the variability in supply (and hence the required overcapacity and the inefficient stop/start of baseload generators) is to diversify the energy sources, so adding wind power will actually improve the net efficiency of gas turbines in the system.
Toby:
1.) Hypothesis of a false state implies nothing. Wind provides statistically insignificant firm capacity. The standard deviation has always extended down into the bogus negative realm in my experience, and that's only a 68 % confidence interval. For the data set in my example the mean power output was 28.5 MW +/- 43.85 MW. If you don't believe me, run your own numbers.
2.) Non-sequetur. Capacity factor is seen from all power sources.
Interesting disscussion, just wanted to post this link to live data from the Spanish Wind generation system - thought it maybe of interest....
http://www.ree.es/ingles/i-index_mapa.html
Ali.
My prediction for 2007 and the future is that we will power the 21st Century using the everlasting wind. I have a patent pending machine I will soon be testing in a wind tunnel. There is nothing the world needs more then unlimited energy. Think how the world will change once the new reality sinks in. Current technology keeps increasing the rotor diameter. Power is proportional to the square of the diameter (P = ½ ρ v3 A), but look at the advantage of the cube of the wind speed could provide.
Post a Comment