The most recent study on the issue, is in fact brand new, using data from last year and published in March 2006 [1]. The study uses high quality industrial data to construct a picture of the embedded energy in photovoltaic modules themselves, their mounting frames, and the balance of system (BOS). This is not the type of back of the envelope calculations you might expect from my blog. Rather they are sophisticated accounts of the entire production process. An Excel spreadsheet is available in the public domain that illustrates the level of detail involved [2].
BOS represents the inverter and other ancillary equipment necessary for solar electric systems. The BOS numbers are based from the photovoltaic plant owned by Tucson Electric Power (TEP) Springerville, Arizona. The system performance is based on an average insolation of 1700 kWh m-2 yr-1 which is typical of Southern Europe. The rooftop systems have 25 % losses to the electrical system while the ground based system 20 %.
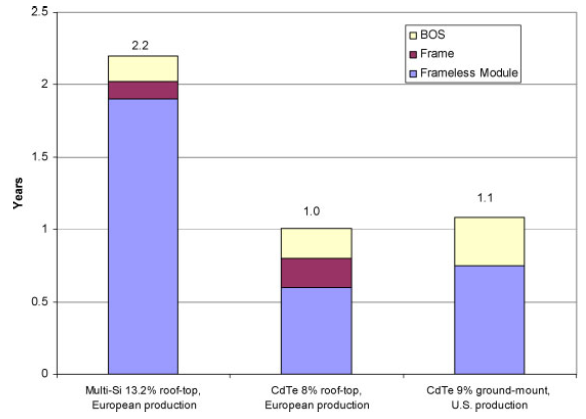 Figure 1: Payback time for complete photovoltaic systems for
polycrystalline Silicon and thin film Cadmium Telluride [1].
As you can see from the graph, the payback period is relatively short. Thin-film systems in general use less semiconductor material than crystalline silicon and hence have a lower embedded energy. The standard warranty for photovoltaic modules today is a guareentee that they will produce 90 % of their rated power after 12 years and 80 % after 25 years. The standard expectation is that they will continue to operate for 40 years, or more. After all, they are solid-state devices with no moving parts. Silicon and other solar cell materials form protective oxide coatings. Pretty much the only thing that can cause damage is bombardment by alpha particles and cosmic rays, which generates defects that act as electron-hole recombination centres.
Based on warranty information photovoltaic systems are guaranteed an energy return on energy invested greater than 10:1. The reason we don't see even more investment in solar electric, wind, and hydro-electric power projects has more to do with the large up-front capital costs than any concern over return rates. The EROEI of some dams in British Columbia has been estimated to be in the 100s, and will continue to grow for the rest of my lifetime.
Greenhouse gas emissions embedded in the production of photovoltaics is, as an obvious consequence, much lower than electrical generation by heat engines. The report by Fthenakis and Alsema finds the CO2 emissions of the polycrystalline-Si to be 37 g/kWh versus 400 g/kWh for natural gas or 900 g/kWh for coal.
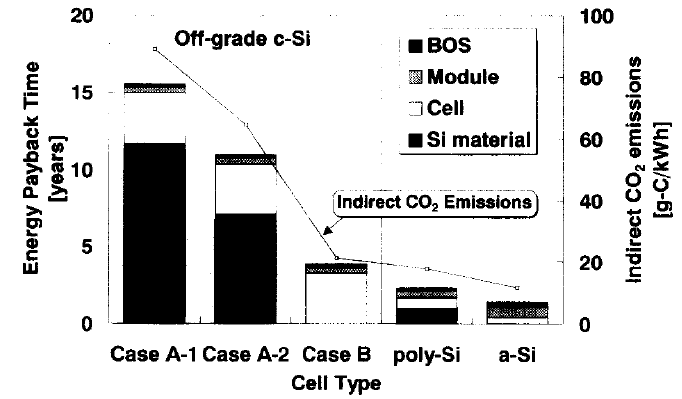 Figure 2: Payback period for off-grade silicon cells
versus polycrystalline or amorphous silicon [3].
An earlier Japanese study on the issue came to a similar conclusion [3]. They also compared PV cells manufactured from the top and bottom of zone-refined ingots that is of lower quality than semiconductor grade silicon.
References
- Fthenakis, V. and E. Alsema (2006). "Photovoltaics Energy Payback Times, Greenhouse Gas Emissions and External Costs: 2004–early 2005 Status." Progress in Photovoltaics14(3):275-280.
- De Wild-Scholten M, Alsema E. "Environmental life cycle inventory of crystalline silicon photovoltaic module production" — Excel file, Report ECN-C–06-002, http://www.ecn.nl/library/reports/2006e/c06002.html
- Kato, K., A. Murata, et al. (1998). "An evaluation on the life cycle of photovoltaic energy system considering production energy of off-grade silicon." Solar Energy Materials and Solar Cells47(1-4): 95-100.
No comments:
Post a Comment